

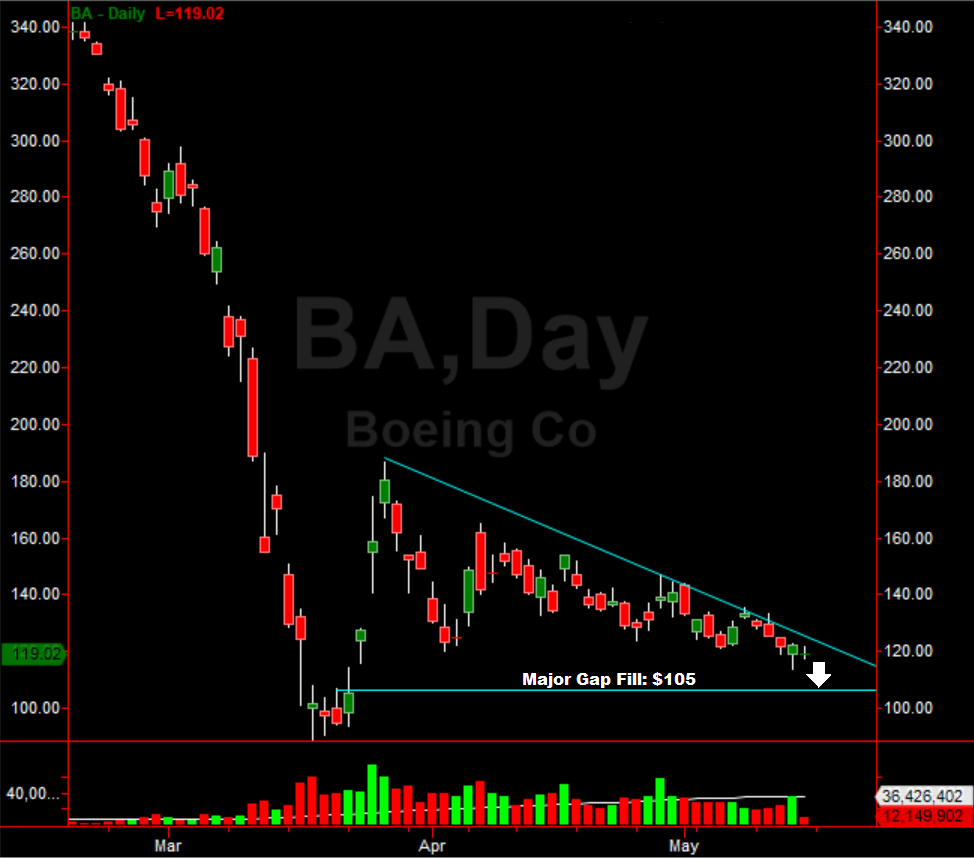
Shares of Boeing Co (BA) continue to grind lower in a weak market. While the economic outlook appears bleak, the Boeing stock chart signals a strong buy at $105.00 (current price as of this article is $119.02). This is a key technical stock chart gap fill. In addition, the consolidation on the daily Boeing chart is bullish. This alerts swing traders looking for a buy on Boeing, they can begin accumulating at $105.00 for a pop potentially as high as $140.00.
Please note that the Boeing stock chart is a swing trade. Swing trading is buying and selling stocks in days/weeks, not holding long term. The idea is that an investor who swing trades can make many times more by buying support and selling resistance and then repeating again. This is only appropriate for seasoned chartists.
(Click on image to enlarge)



Comments
Log in or sign up to join the conversation.