

Binance/ U.S.dollar(BNBUSD)BNBUSD Elliott Wave Technical Analysis
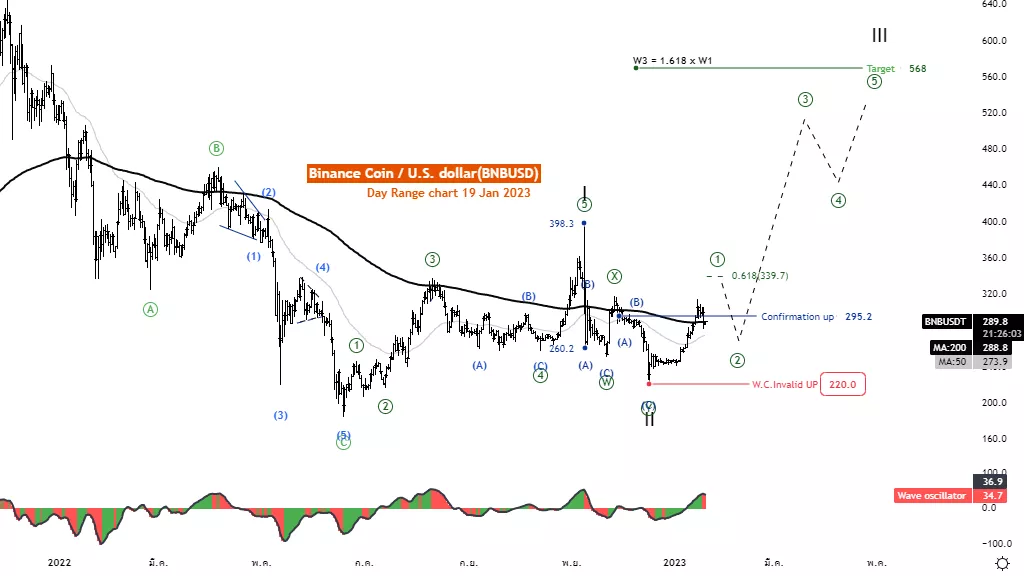
Function: Follow trend Mode: Motive Structure: Impulse
Position: Wave III Direction Next higher Degrees: wave III of Motive Details: Wave III is usually 1.618 x Wave I in length. Wave Cancel invalid level: 183.4
Binance/ U.S.dollar(BNBUSD)Trading Strategy : Binance coin has recovered well from the 220 level and managed to break the MA200, signaling the weakening of the downtrend.
As a result, the trend may change to an uptrend. And there is a trend towards the price target at level 568, but even so, this is only the beginning of an uptrend.
Price may be reversed before rising again Binance/ U.S.dollar(BNBUSD) Technical Indicators: The price is below the MA200 indicating a downtrend.
The wave oscillators above Zero-Line momentum are bullish.
Elliott Wave Analysis TradingLounge 4H Chart, 19 January 23,
Binance/ U.S.dollar(BNBUSD) BNBUSD Elliott Wave Technical Analysis
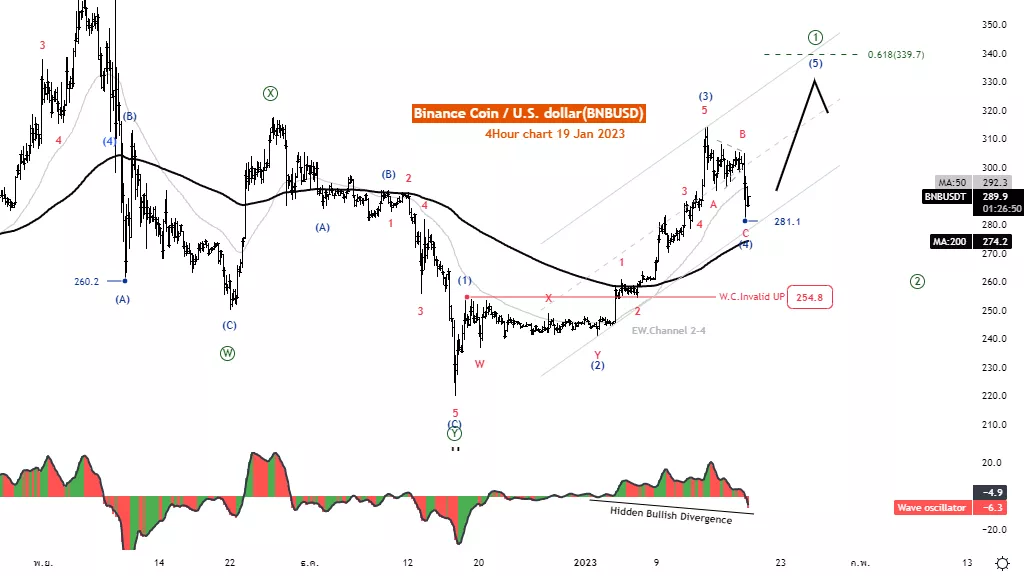
Function: Counter trend
Mode: Corrective
Structure: Zigzag
Position: Wave C
Direction Next higher Degrees: wave (4) of Motive Details: Wave (4) usually retraces 32.8% of wave 3.
when ends the price increase again in wave (5) Wave Cancel invalid level: 254
Binance/ U.S.dollar(BNBUSD) Trading Strategy : Binance Coin is still in the structure of Impulse Wave uptrend, lacking another rise in wave 5, at the end of which the price will reverse again.
Binance/ U.S.dollar(BNBUSD) Technical Indicators: The price is above the MA200 MA50, indicating an uptrend.
The wave oscillators have hidden bullish divergence the price trend reversal.
More By This Author:
U.S. Stock Market Report - Elliott Wave Analysis
Elliott Wave Technical Analysis: Netflix - Jan. 18
Elliott Wave Technical Analysis: VeChain / U.S. Dollar



Comments
Log in or sign up to join the conversation.