

Quick summary XLP (Consumer Staples Select Sector SPDR ETF) delivered a textbook Elliott Wave reaction. Buyers stepped in at the defined blue‑box zone, turning a corrective pullback into fresh highs. Let’s look at the before and after snapshots.
Before — October 26, 2026 (1‑Hour Chart)
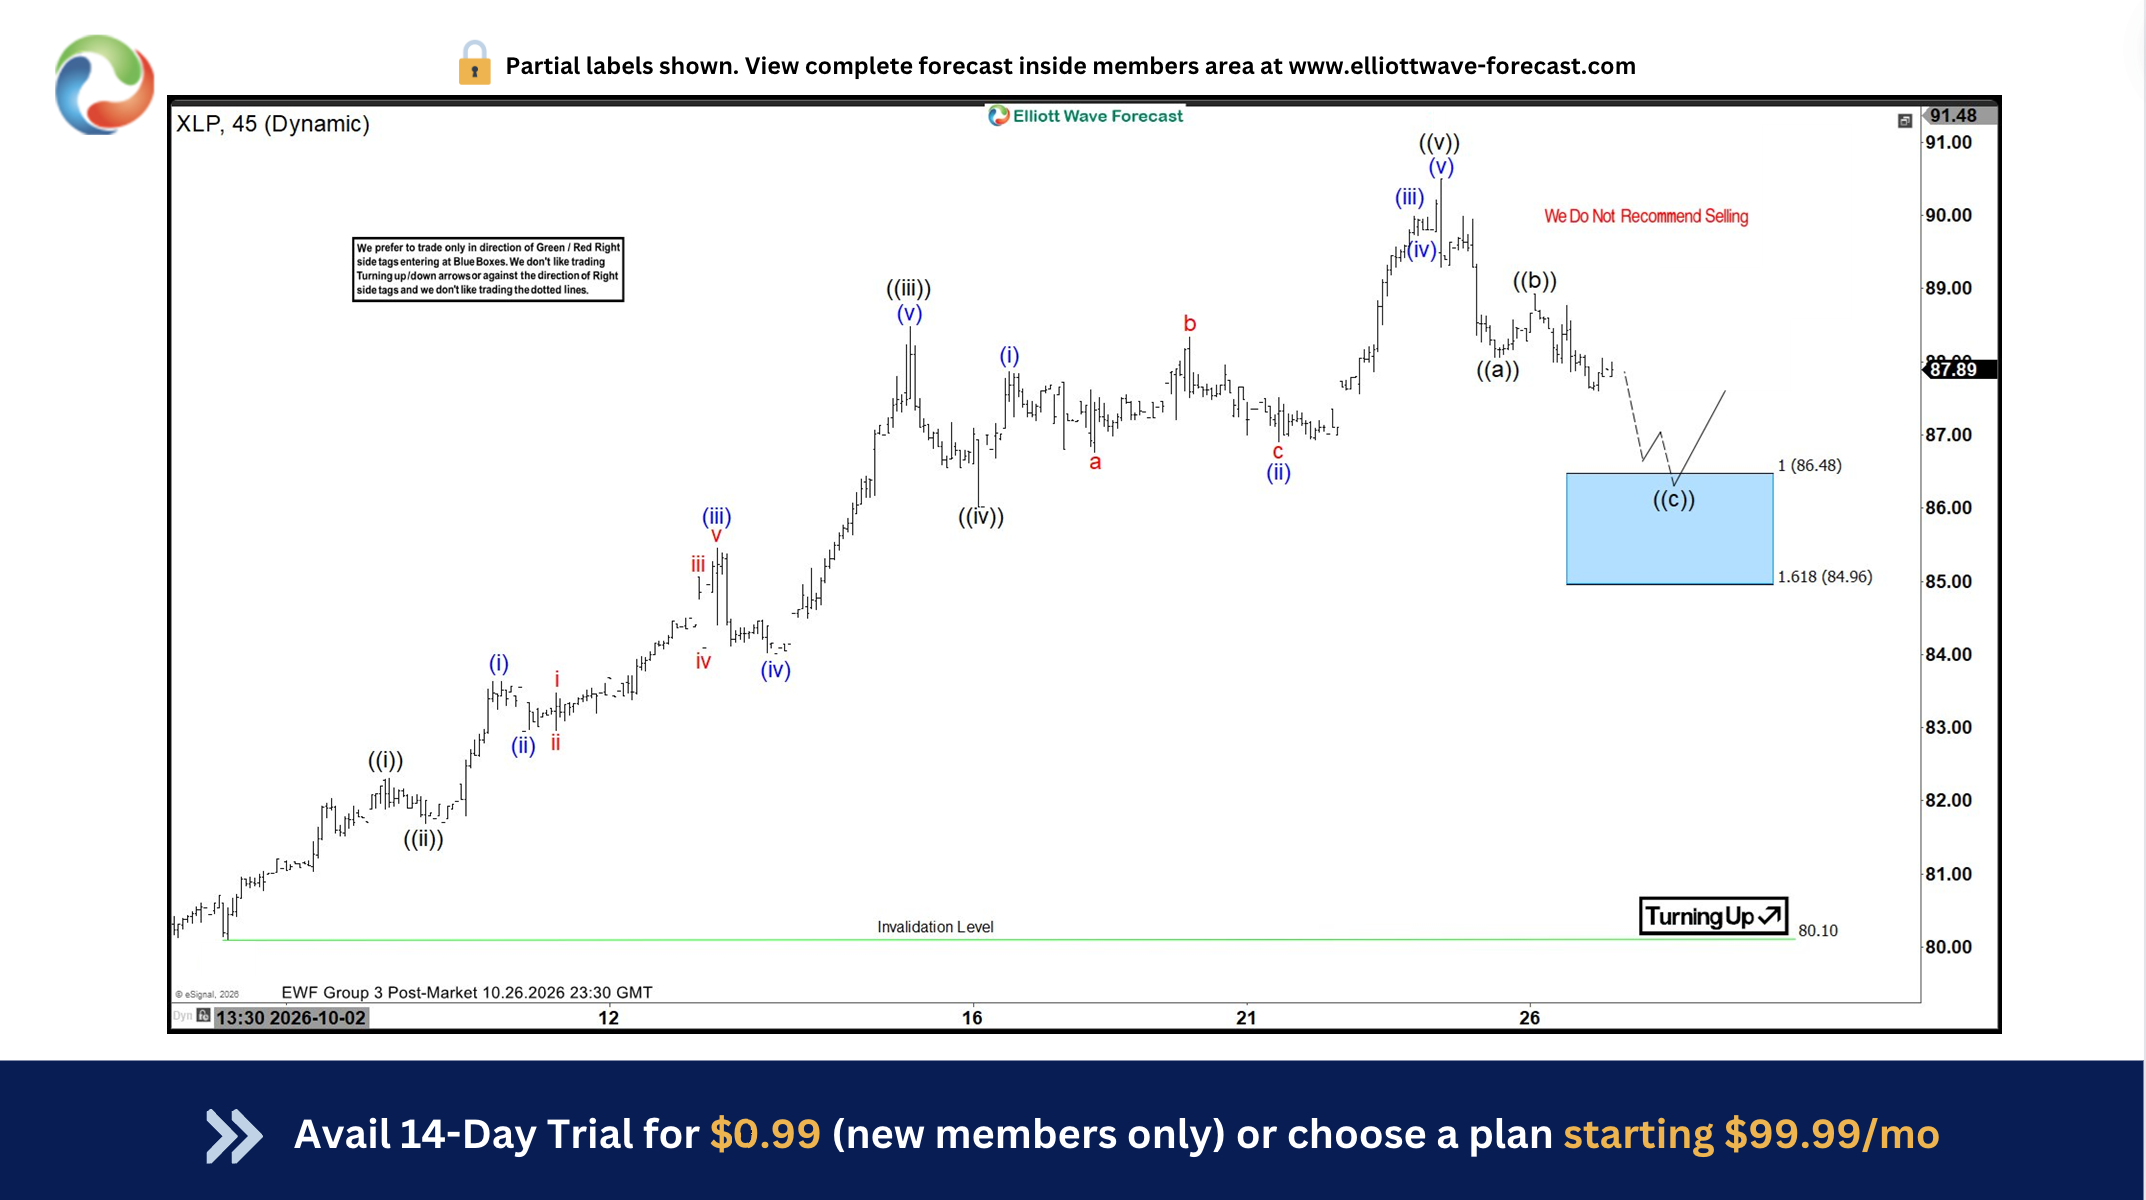
Rally from the October 5 low ended at $90.50.
The pullback unfolded as a zigzag correction:
Wave ((a)) ended at $88.06.
Wave ((b)) bounced to $88.93.
Wave ((c)) reached the blue‑box zone $86.48–$84.96.
This zone was highlighted as a buy area, where buyers were expected to appear for at least a three‑wave bounce.
After — November 3, 2026 (1‑Hour Chart)
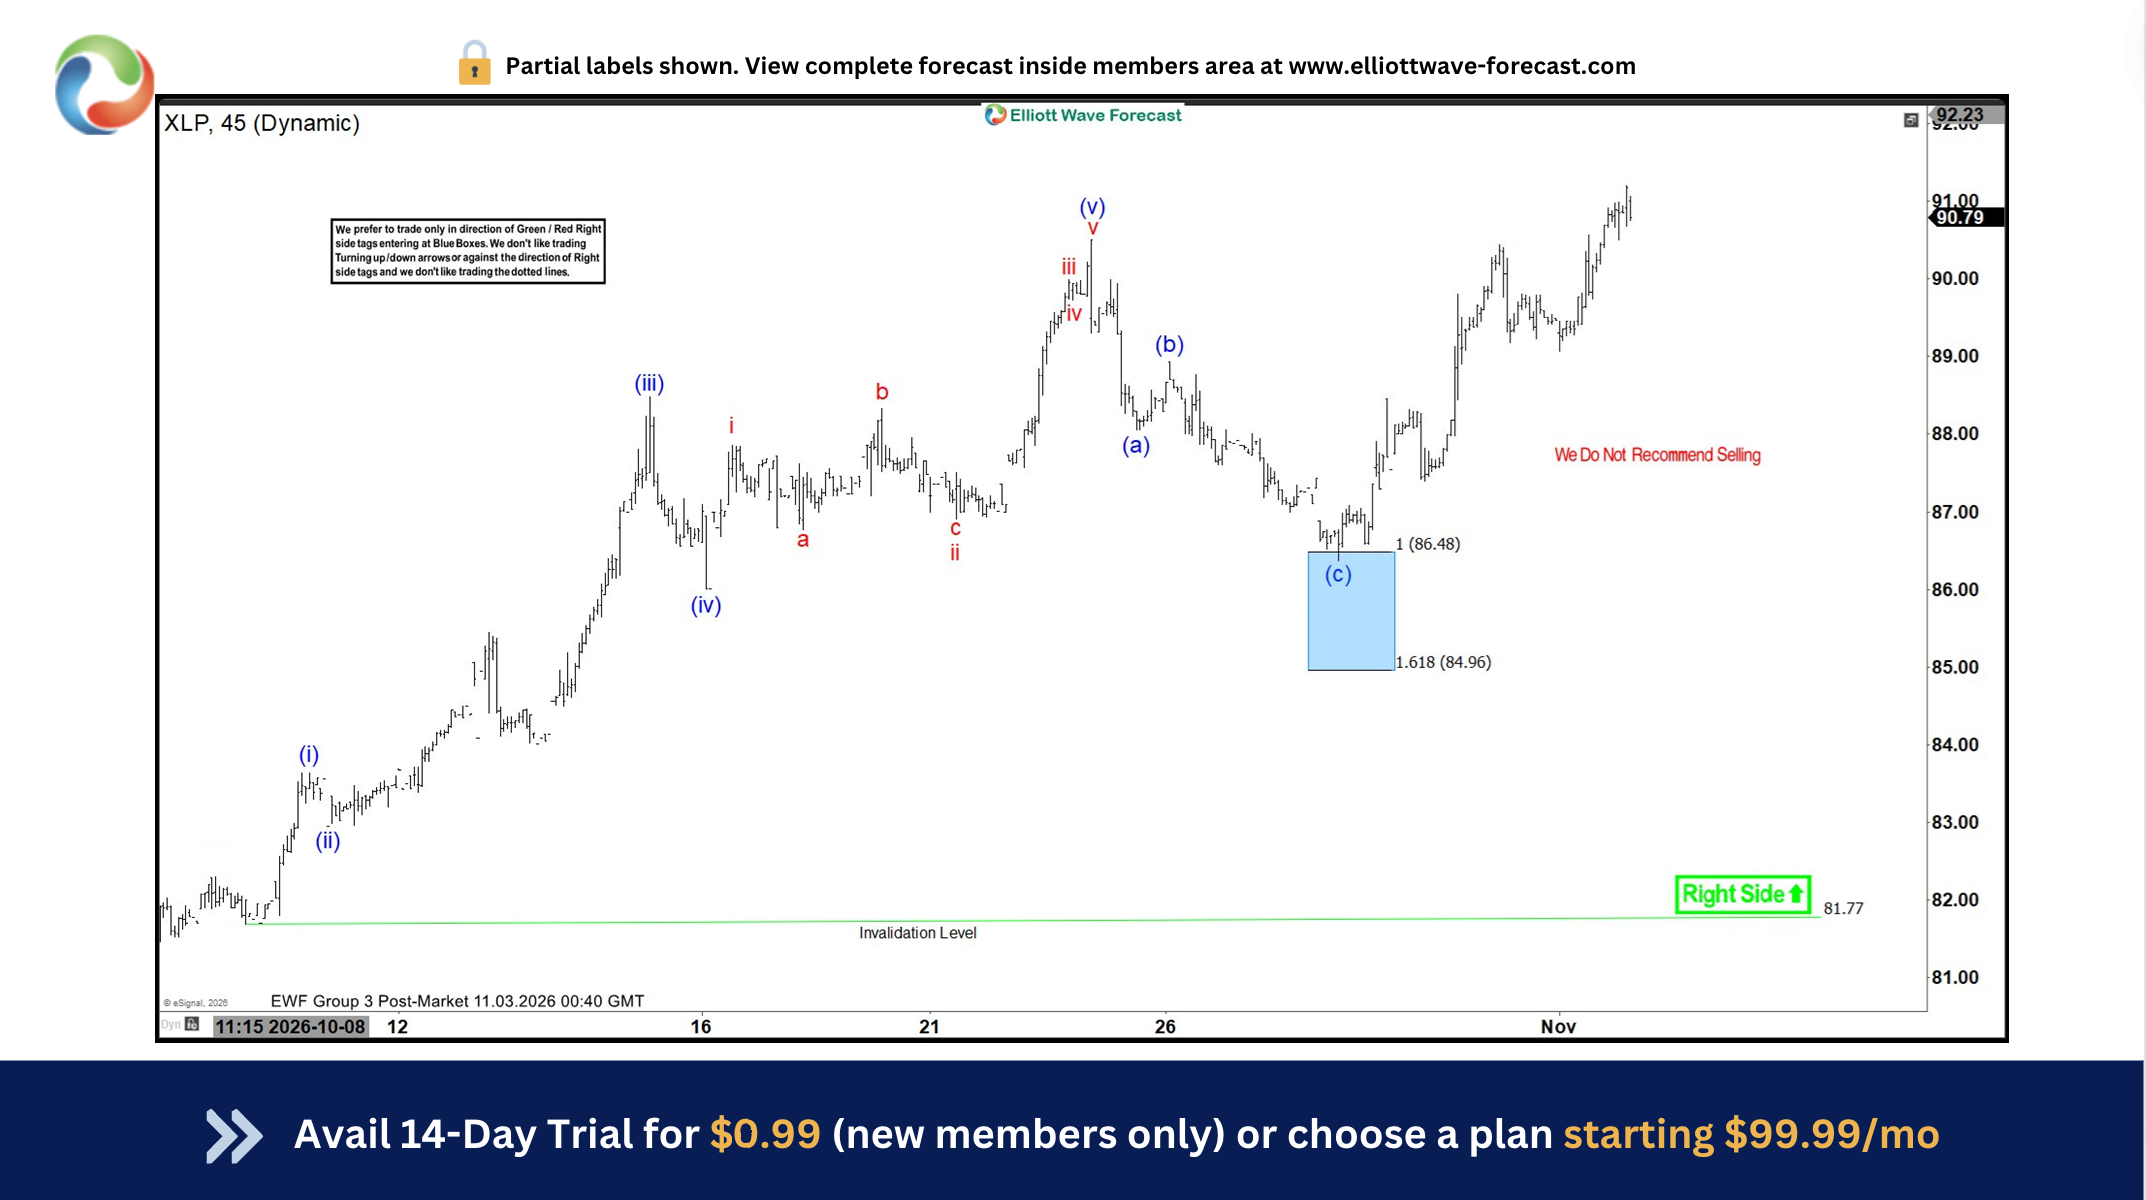
XLP reacted strongly higher right after completing the correction in the blue box.
Members who entered at the blue box quickly converted positions to risk‑free once stops were adjusted.
The ETF has already made a fresh high above $90.50, validating the blue‑box strategy.


Comments
Log in or sign up to join the conversation.