

Bitcoin broke above the round resistance levels of $25,000 and $27,500 with ease. The massive bullish momentum seems to be confirming an impulsive wave 3 of a higher degree.
What can traders expect in this bull run? Let’s review the key Fibonacci support levels.
Price Charts and Technical Analysis
(Click on image to enlarge)
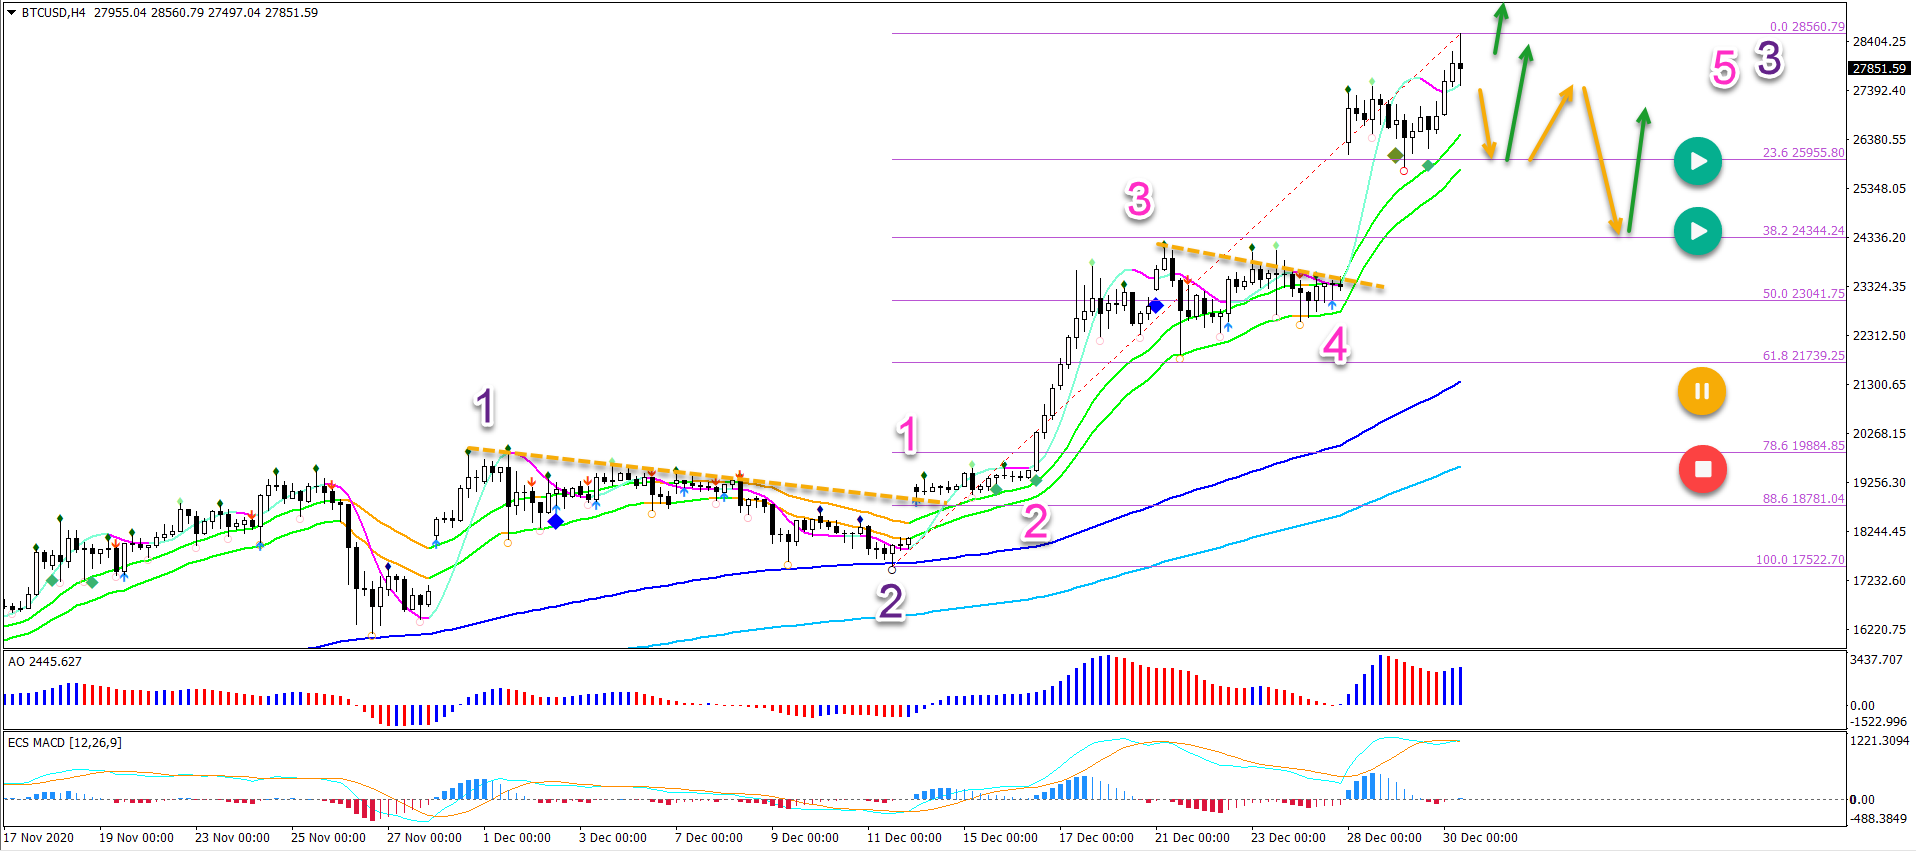
The BTC/USD train is now approaching the $30,000 mark. An immediate push higher (blue arrow) towards the next round level is one of the possibilities.
The 30k target could create some selling and a pullback. However, as long as price action shows choppy corrections, more upside continuation remains the most likely scenario.
Another alternative is that price action will show a retracement before hitting 30k. Then price could fall back to the 23.6% and 38.2% Fibonacci retracement levels. This a potential support zone and bullish bounce.
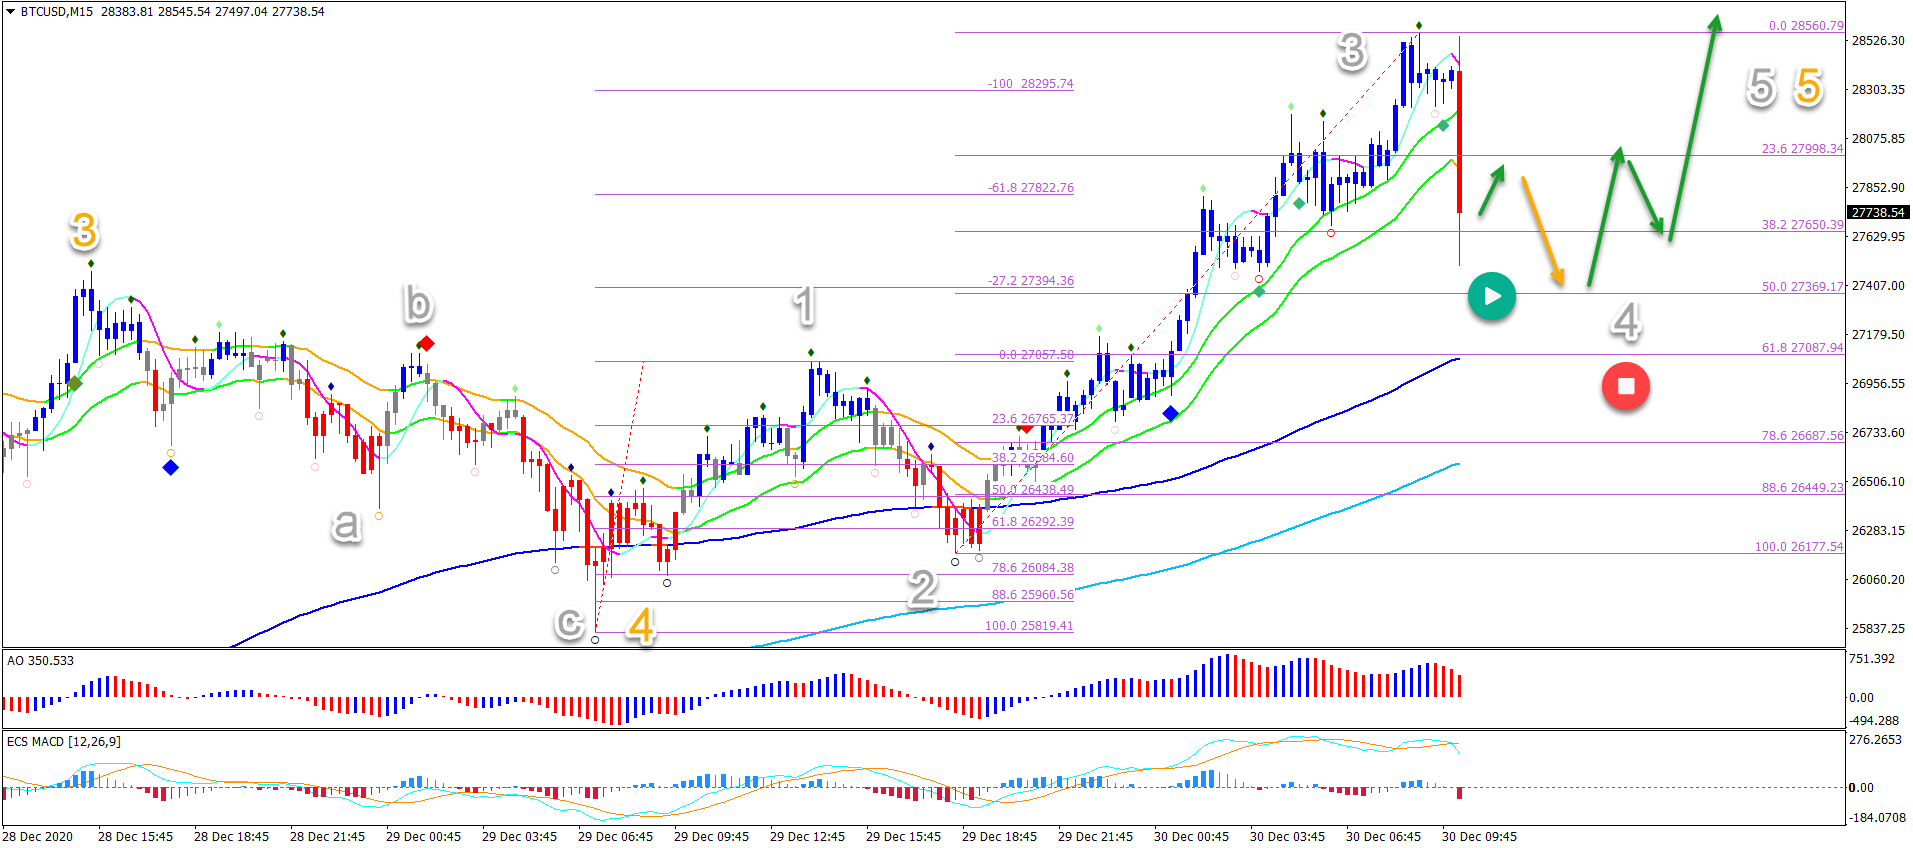
On the 15 minute chart, we can try to estimate whether that immediate continuation will occur or whether price action will create a retracement first.
The key support zone is the 38.2-50% Fibonacci levels. A bullish bounce would confirm a wave 4 (grey) pullback on the lower time frame. And the uptrend could continue within the wave 5 (grey).
Whereas a bearish break below the 61.8% Fib invalidates (red circle) the current wave outlook. This could be the first indication that a deeper pullback is taking place on the 4-hour chart.
(Click on image to enlarge)



Comments
Log in or sign up to join the conversation.