
During the last few sessions, we have witnessed a strong rebound again in the cryptocurrency sector. Bitcoin has once again surpassed the psychological $50,000 mark after confirming the rebound at the important support level, as we discussed in our analysis of 24 September.
This Bitcoin rebound is also causing a bullish momentum in Ethereum, which has recovered 3,500 dollars, retaking levels from last September. Although, for the moment this rebound is not occurring in other cryptocurrencies such as Litecoin or Ripple, so we must be very attentive in the coming sessions, as they could experience a strong rebound if Bitcoin manages to maintain this new momentum.
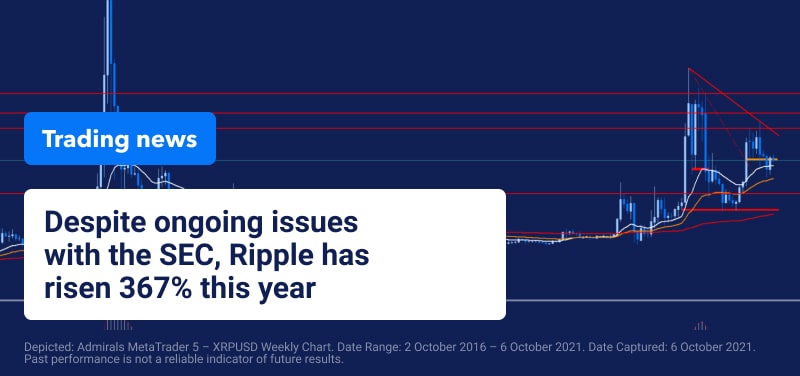
Ripple maintains its dispute with the US SEC, although after a long battle in court it seems that Ripple may emerge triumphant from this situation. However, we must be very attentive to the evolution of this situation, as both a final favourable resolution and a ruling against it could cause even more volatility in this instrument.
After three very tough years, with a significant sideways movement after the sharp falls of 2018 due - among other things, to the legal problems mentioned above - this year, XRPUSD has gradually regained importance among investors. So far this year, it has been experiencing strong rallies that took the price from a level close to 0.20 USD to mark annual highs on 14 April at around 1.96 dollars as we can see in the weekly chart. So far this year, Ripple has appreciated by 367%.
(Click on image to enlarge)
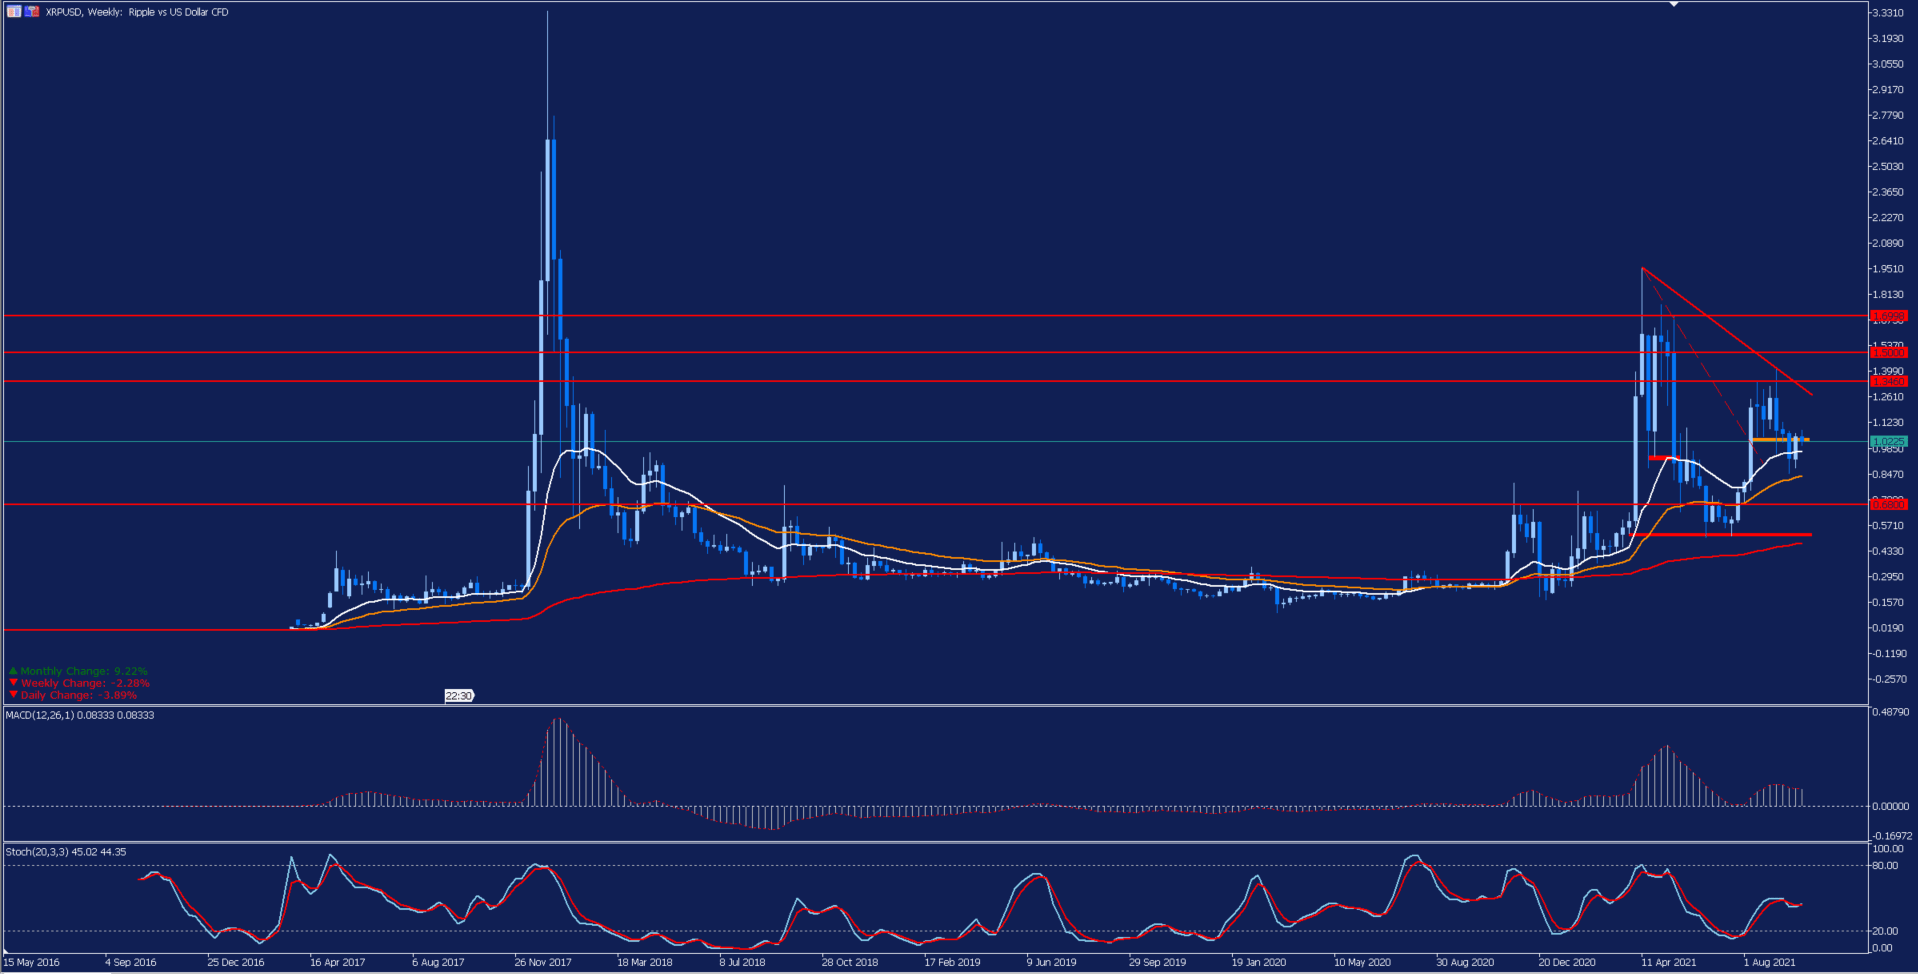
Depicted: Admirals MetaTrader 5 – XRPUSD Weekly Chart. Date Range: 2 October 2016 – 6 October 2021. Date Captured: 6 October 2021. Past performance is not a reliable indicator of future results.
If we focus on the daily chart we can see how, after making yearly highs, the price began a strong downtrend that led it again to break several support levels, until forming an important floor at the lower red band around 0.50 USD. From here, it started a new upward momentum that has led it not only to break above its 200-session average, but also to break above its first medium-term downtrend line represented by the dashed line.
At the moment, its 200-session average in red is its main support level; and after making a new impulse at this level, the price is fighting to overcome its important support/resistance level represented by the orange band. Therefore, we will have to be very attentive to the evolution of the price.
If it is able to overcome this level, we could see a new bullish momentum that will lead the price to look for its important downtrend line. A further break above this level would open the door to an upward move that could target the yearly highs, although it would first have to face several resistance levels.
On the contrary, a failure in this attempt could trigger a further correction in search of its 200-session average. The loss of this level could take the price back to its yearly lows in the lower red band.
As mentioned above, the evolution of the ongoing situation with the SEC could be key in the coming months, so we will have to pay close attention to its outcome.
(Click on image to enlarge)
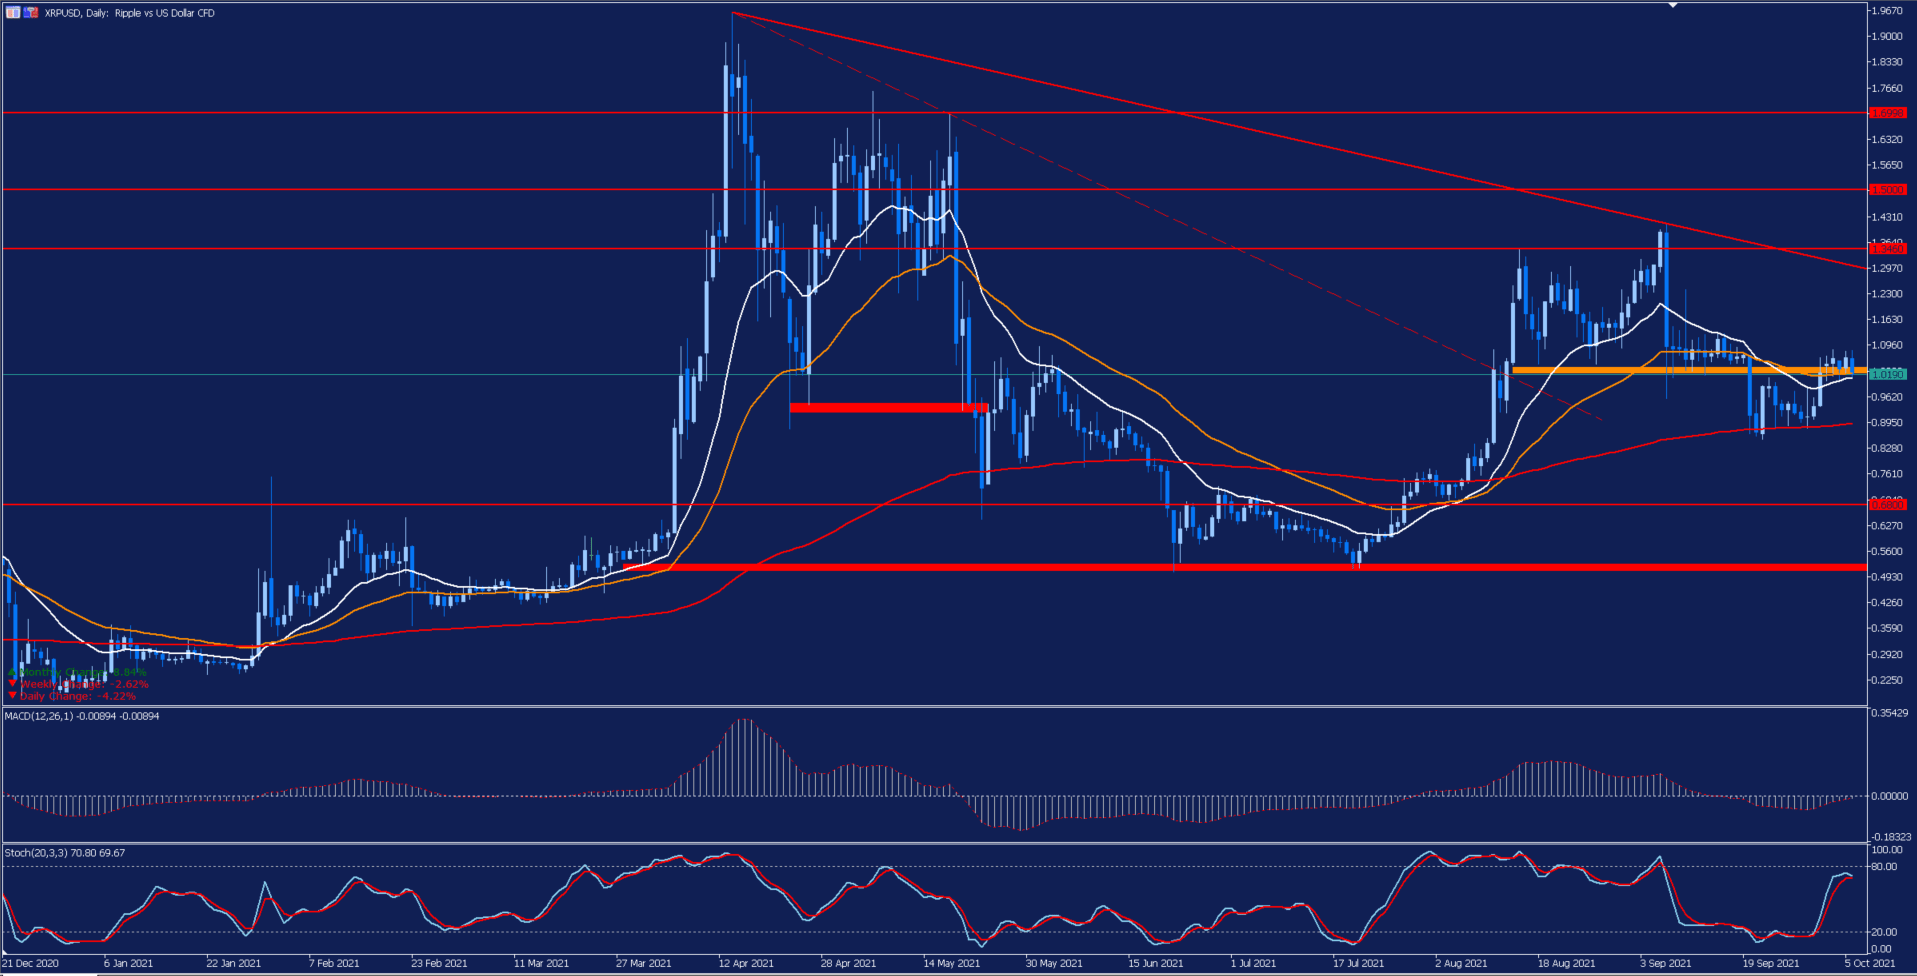
Depicted: Admirals MetaTrader 5 – XRPUSD Daily Chart. Date Range: 20 December 2020 – 6 October 2021. Date Captured: 6 October 2021. Past performance is not a reliable indicator of future results.
Evolution of the last five years:
- 2020: 13.64%
- 2019: -45.03%
- 2018: -83.27%
- 2017: 30,310.07%
- 2016: 25.01%


Comments
Log in or sign up to join the conversation.