


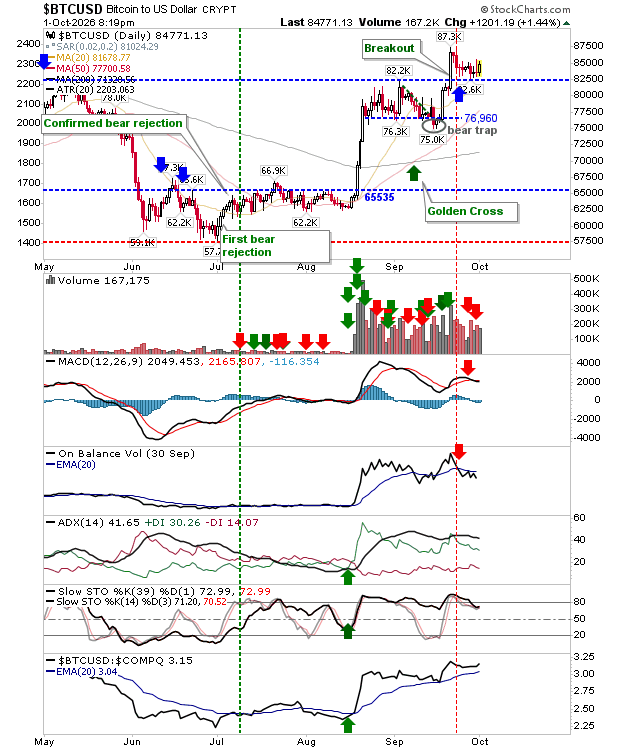
The last couple of days for Bitcoin (BTC.X) had pointed to indecision on a series of doji, but today's white candlestick above 82.5K breakout support suggests we may yet get another kick on higher. In a manner, it's a victim of its own success as market indices have headed in the other direction. On a positive note, 82.5K should be strong support. If there was a concern, it's that On-Balance-Volume is running below its 20-day MA which may suggest undercover distribution is at work; if 82.K support is lost then further loses are likely.
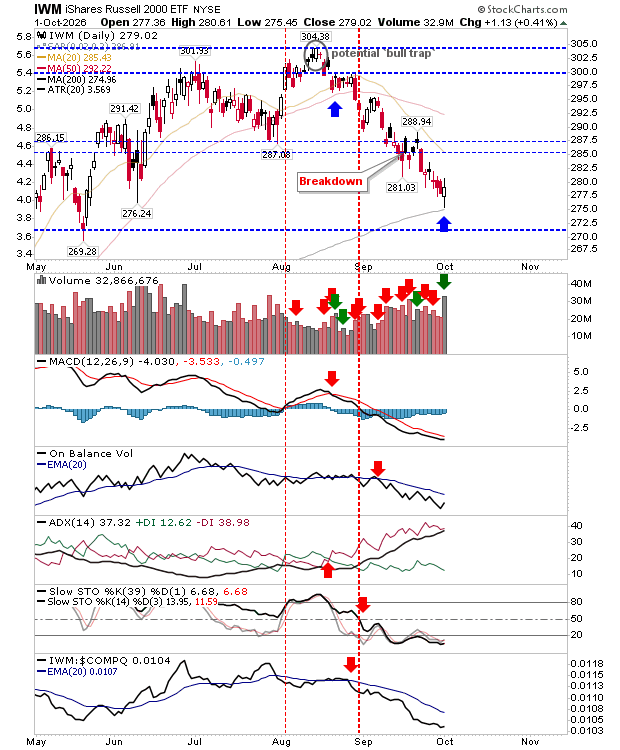
There are opportunities. The Russell 2000 (IWM) has done enough to register a tag of its 200-day MA. It posted a neutral candlestick (spinning top), but it did finish with a higher close on accumulation volume. I would like to see another spike low - effectively anything that makes a quick trip below $277.30 and then recovers by the close - this would firm up a trade worthy swing low, particularly as we have had no rallies of note since the bull trap above $300. Options traders may get some reward here.
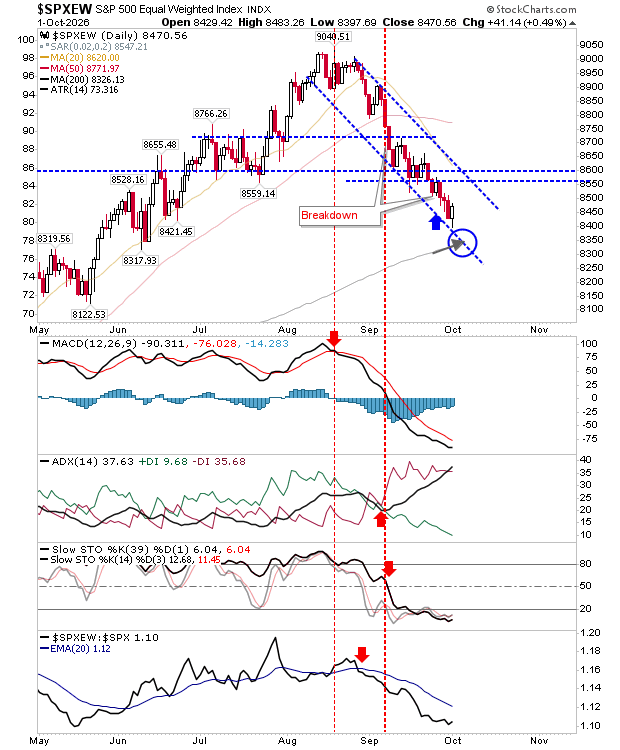
The equal-weighted S&P (SPY) (RSP) didn't quite make it to its 200-day MA but finished with a slightly more bullish candlestick than the Russell 2000. The index is deeply oversold on net bearish technicals, but it kind of needs another bullish candlestick to firm up a swing low.
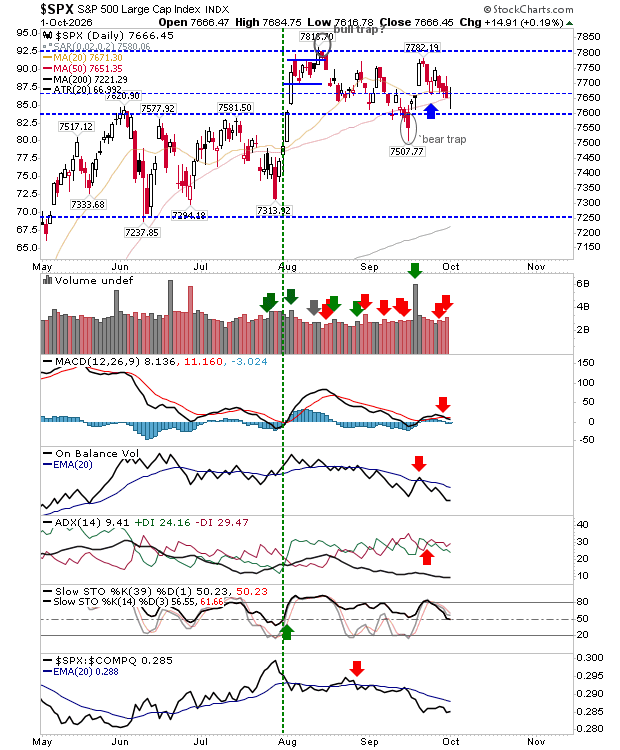
The S&P had an interesting day. It undercut 7,650 in what looked to be a long-stop washout and finished with a (bullish) dragonfly doji, returing above 50-day MA support. Stochastics are still holding the mid-line, although it may dip below the line early next week. What I like most about this is that despite the headlines the index continues to trade above 7,600. Price action is king.
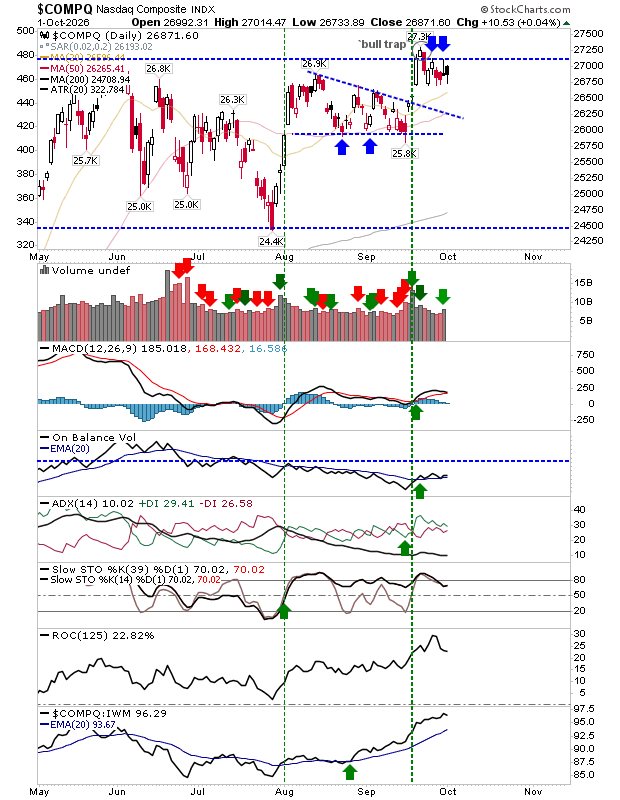
The Nasdaq (QQQ) is another conundrum. Yesterday, it was a clear shorting opportunity on the 'gravestone' doji that tagged the 'bull trap'. It may still be a shorting opportunity as I don't like 'black' candlesticks, but traders are defending 26,750 - and until they stop doing so, this is a long play. If you are short, I would wait to see if 27,200 was about to be breached before covering. Unlike peer indices, technicals are net bullish.
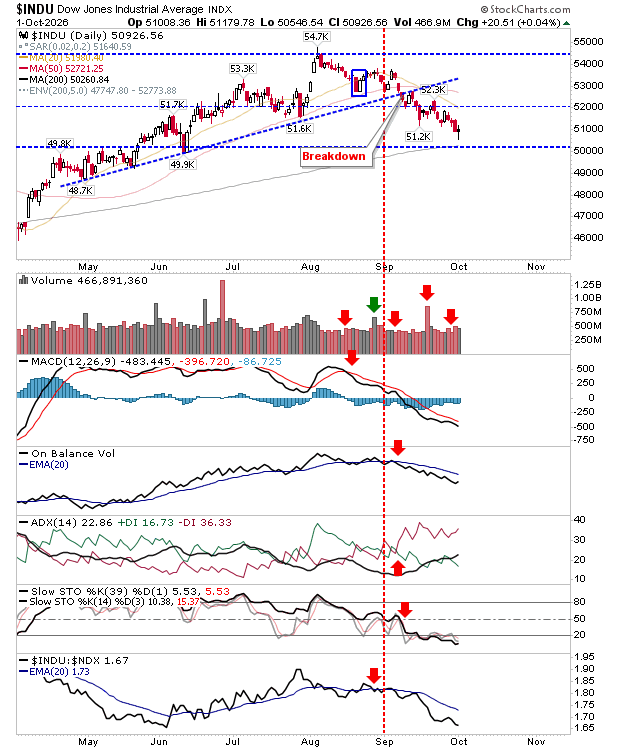
I haven't covered this in a while, but the Dow Industrial Average (DIA) has been posting steady loses on net bearish technicals. The 200-day MA has converged at horizontal support, also at psychological 50K support. Today's doji came close to tagging the 200-day MA, but there is long opportunity here for a move to 52K, and maybe more.
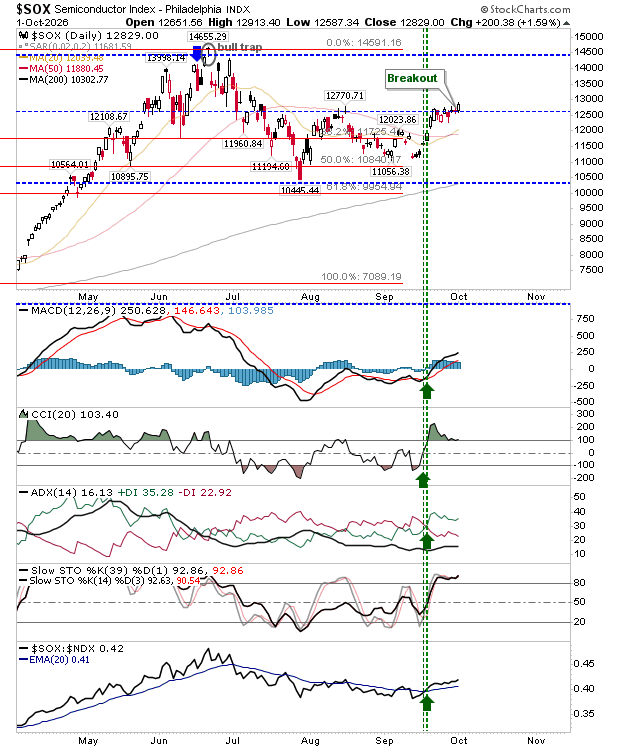
Semiconductors (SMH) edged a breakout as part of its base development. It was a relatively subtle move but with technicals net bullish it has the potential to kick on higher. The risk is a 'bull trap' over the next couple of days, which is an aggressive short. The risk is real, because a 'bull trap' would turn this ugly quick, making a test of the 200-day MA a downside target.
It's good to see trading opportunities on both sides of the fence. Investors don't have an immediate concerns, but if you need to take profits, now is not a bad time.


Comments
Log in or sign up to join the conversation.