

On December 16, 2020, it will go down in the history of financial markets, especially in the digital currency or cryptocurrency market, that Bitcoin finally surpassed, after several unsuccessful attempts, the psychological level of $20,000 after a sharp rise of 9.87% in yesterday's session.
This break has possibly been one of the most anticipated breaks in recent years, after this possibility was speculated in December of 2017, after Bitcoin reached its historical maximum that it has respected over the past 3 years of $19,419.25.

Unlike the strong rises of the past in which they were mainly based on investor speculation, this time, this rise is being supported by institutional investors that support this product. Recently, important banks such as The Spanish BBVA have announced that, as of 2021, they will allow their clients to buy, sell and store Bitcoin through their subsidiary in Switzerland, although they will later expand this possibility to other cryptocurrencies.
This strong momentum has also dragged the rest of the main cryptocurrencies, as Ethereum, Ripple or Litecoin are also experiencing strong increases, but they are still far from their all-time highs, so they may still have a bullish journey.
What to expect from Bitcoin in the coming days
Technically speaking, as we can see in the weekly Bitcoin chart, for practically the past 3 years the price has moved within a strong triangle between the red downtrend line and the important support band around $3,000, supporting the price on two occasions on its average of 200 sessions in the red.
It’s interesting that, despite the important amplitude range of this triangle with the strong drops and rises, the short and medium-term moving averages (black and orange) did not break down to their 200-session moving average, which stresses the importance of this support level.
Currently, the three moving averages are on an upward slope, thus reinforcing the trend together with the strength we observe in the MACD indicator, leading the price to exceed $23,000.
On the other hand, we can see that our stochastic indicator is at overbought levels, and although this does not imply that the price cannot continue to rise strongly, we cannot rule out that the price may make a correction after these last increases and again test $20,000, which is currently acting as the main support level.
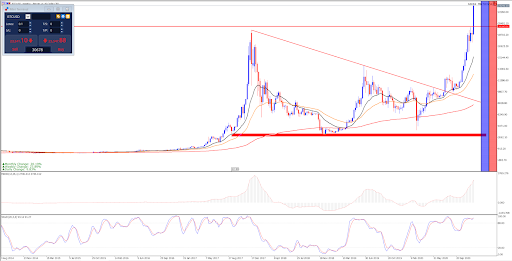
Source: Admiral Markets MetaTrader 5 Supreme Edition. Weekly evolution of BTCUSD from September 28, 2014, to December 17, 2020. Chart prepared on December 17, 2020. Please note that past performance is not a reliable indicator of future results.
In the last 5 years, Bitcoin has appreciated 7,103%.



Comments
Log in or sign up to join the conversation.