
Intraday Flashback – Support Reaction and Recovery Setup
In the recent intraday sessions, BTCUSD showed signs of slowing downside momentum. The decline appeared corrective rather than impulsive, suggesting the market was preparing for a recovery within a broader corrective structure.
Bitcoin approached a key 78.6% Fibonacci retracement level, identified as an important support zone for subwave (C) of wave B. This area aligned with prior lows and a potential wedge formation, making it a critical technical decision point.
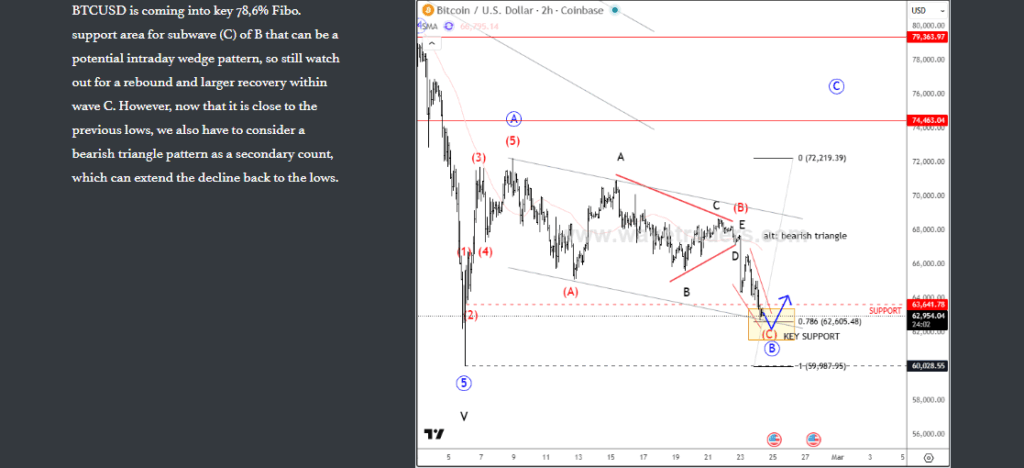
The primary expectation was that price would stabilize near Fibonacci support, complete the wedge structure, and begin a recovery phase.
The market respected the key support region and produced a sharp rebound, confirming the corrective scenario. This reaction indicated that selling pressure was fading and that a stronger recovery phase was beginning.
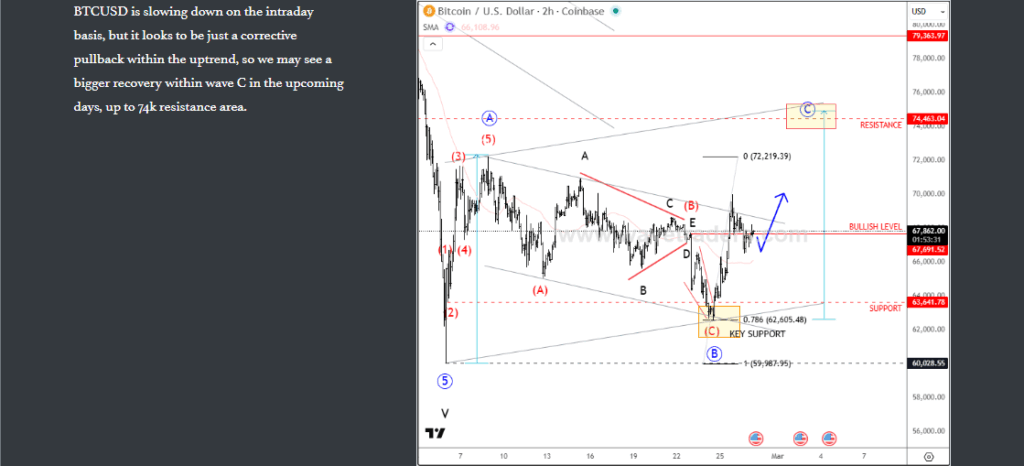
Overall, the price action suggested that the pullback was only a temporary correction within a larger recovery structure.
Fresh Update
So far, the market is already retesting channel resistance near 69000, where we could see a push out of that channel. If that breakout happens, it could open the door for a wave C rally.
In that case, there is room toward 74000, which is the first resistance shown on the 4 hour chart. Keep in mind that in zigzags, wave C can be similar in length to wave A, and that equality comes near the 38.2% level around 74500. So this could be a very important level in the next few days.
It is also worth watching stocks. If stocks hold support and push out of their recent ranges, it would be much easier for Bitcoin to complete wave C at higher prices. If stocks continue to consolidate, then upside on BTC could remain limited.
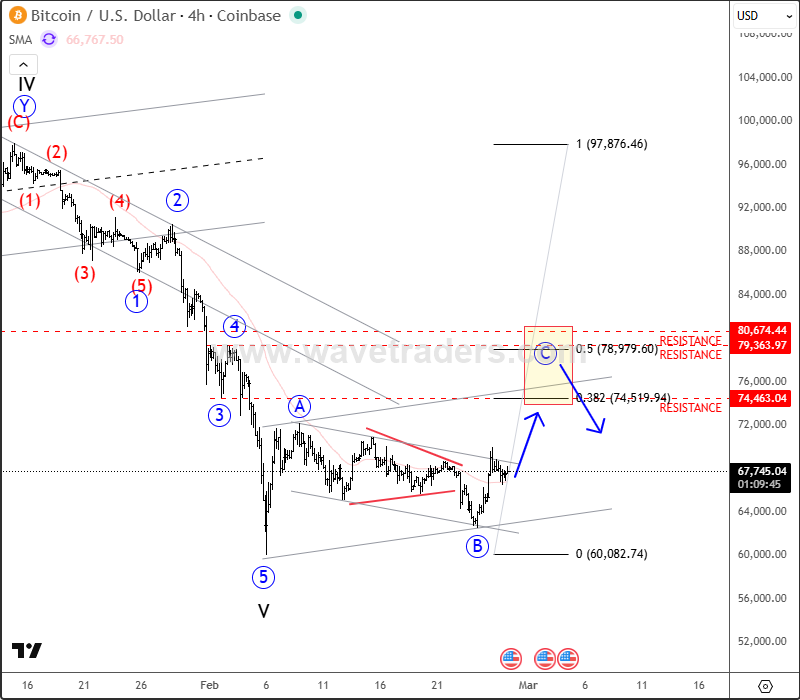
BTCUSD 4H Chart
Zig-Zag Correction – Basic Rules and Guidelines
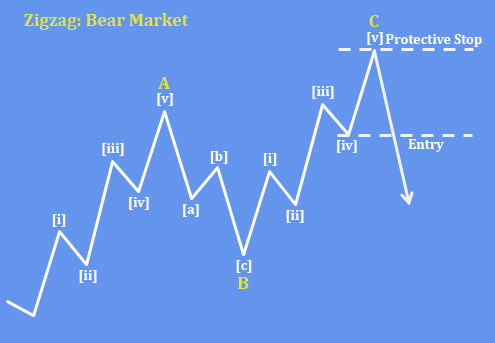
A zig-zag correction is one of the most common Elliott Wave corrective patterns and follows a 5–3–5 structure labeled A–B–C.
Core Rules
Wave A forms a five-wave impulsive or diagonal structure
Wave B forms a three-wave corrective structure
Wave C forms a five-wave impulsive or diagonal structure
Wave B typically retraces 38.2%–78.6% of Wave A
Wave C often equals Wave A or extends to 1.618 × Wave A
For a detailed view and more analysis like this, you may want to watch below our latest recording of a live webinar streamed on February 23: DIRECT LINK


Comments
Log in or sign up to join the conversation.