


Bitcoin declined as anticipated over the past couple of weeks and now appears to have completed the projected five-wave impulsive move on the 4-hour chart as discussed on June 29. This outlook is reinforced by the strong rebound back above the Elliott Wave channel resistance, suggesting that the bearish sequence has likely ended.
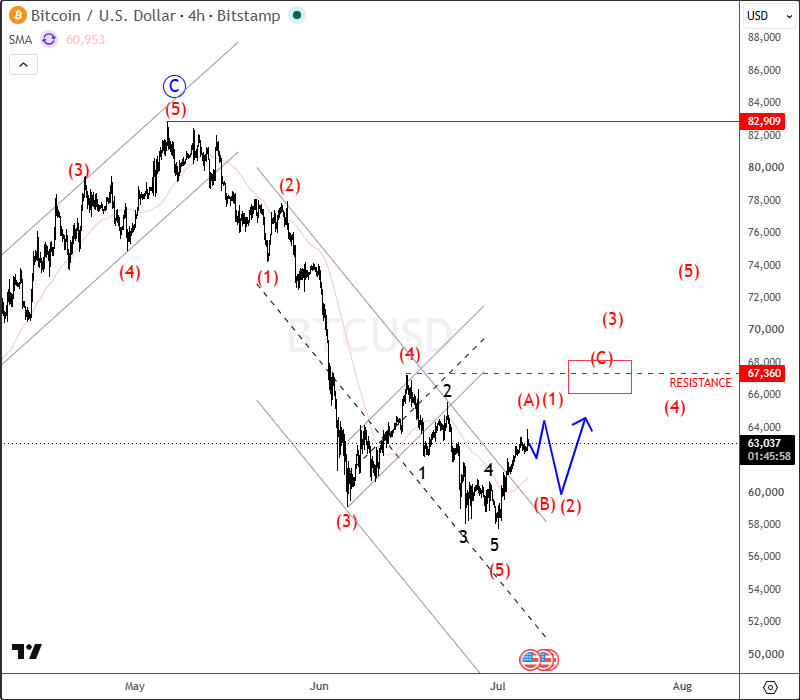
From here, the market is expected to develop a corrective recovery phase, ideally unfolding as a three-wave A/1–B/2–C/3 structure. The initial upside objective remains the $67,000 resistance zone, which represents a key area where wave C or wave 3 could complete.
On the lower timeframes, BTCUSD is showing a sharp intraday recovery, which appears to be unfolding as an ongoing five-wave impulse into wave (A)(1). Within this structure, price is currently progressing through wave 4, suggesting that one final push higher in wave 5 may still be ahead before this intraday impulse completes.
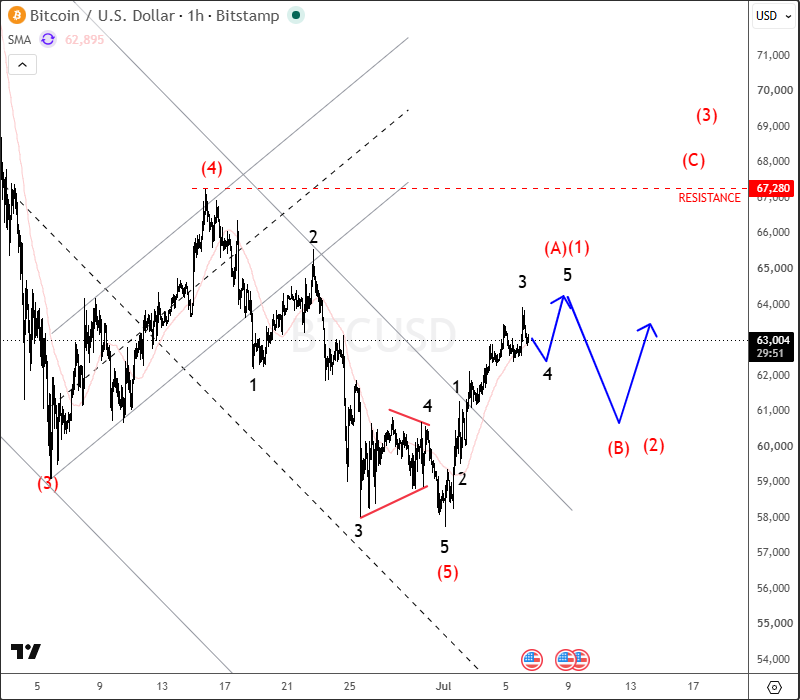
This would typically mark the end of wave (A)(1), after which a corrective wave (B)(2) pullback could develop before the broader bullish continuation resumes.
However, an important invalidation/alternative scenario remains in play. If price breaks and sustains a move below the $61,000 area, it would suggest that wave 5 has already been completed. In that case, BTCUSD would likely transition directly into wave (B)(2), opening the door for a deeper intraday correction before the next larger impulsive advance into wave (C)(3).
For a detailed view and more analysis like this, you may want to join our live webinar today on July 06 @ 15.00CET: DIRECT LINK.


Comments
Log in or sign up to join the conversation.