
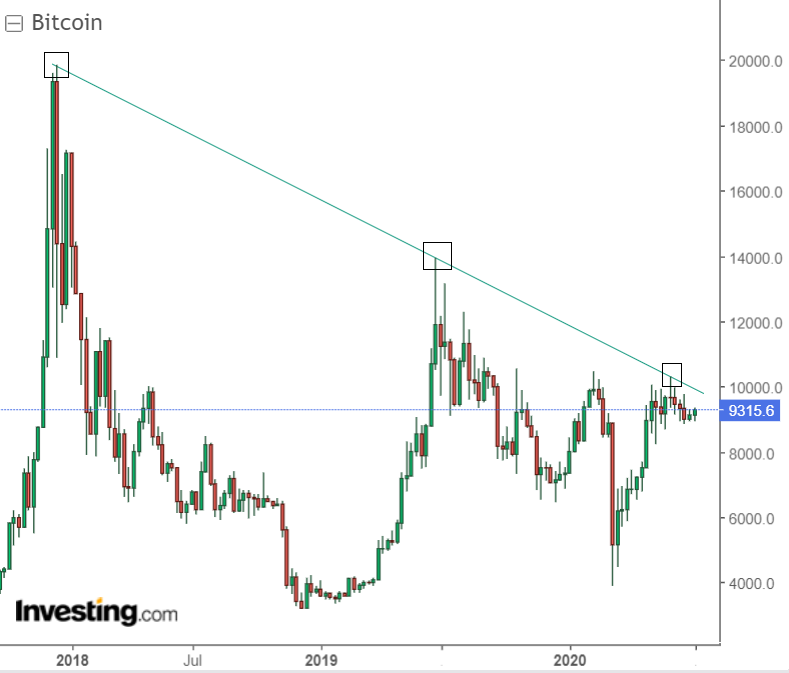
Bitcoin continues to be stuck in a trading range between 9,000 and 10,000. Bitcoin chart analysis signals the consolidation range is bullish but it is important to remember that the big move will not truly begin until a major trend line is broken to the upside. This trend line is found easily by connecting the all-time highs near 20,000 back in December 2017 and the secondary high pivot of 14,000 in June 2019. By connecting those two points, the exact high of from June 2020 is given just over 10,000. Bitcoin continues to trade under that level. For crypto traders, look for that break-point to kick off an epic move back to 20,000 and beyond.
The environment of money printing in the trillions continues for not just global governments but central banks as well. This is exactly why cryptocurrency was created. Look for money flow to start moving from stocks into the lagging crypto market and a breakout likely within the next month. Check out the Bitcoin chart analysis below.
(Click on image to enlarge)


Comments
Log in or sign up to join the conversation.