

Bitcoin (BTC/USD) made a bullish bounce at the 78.6% Fibonacci retracement level. It was followed by a bullish breakout above the 21 ema resistance zone as expected in our analysis.
This article analyses the expected Elliott Wave and Fibonacci patterns on the Bitcoin 4 hour and 1 hour charts.
Price Charts and Technical Analysis
(Click on image to enlarge)
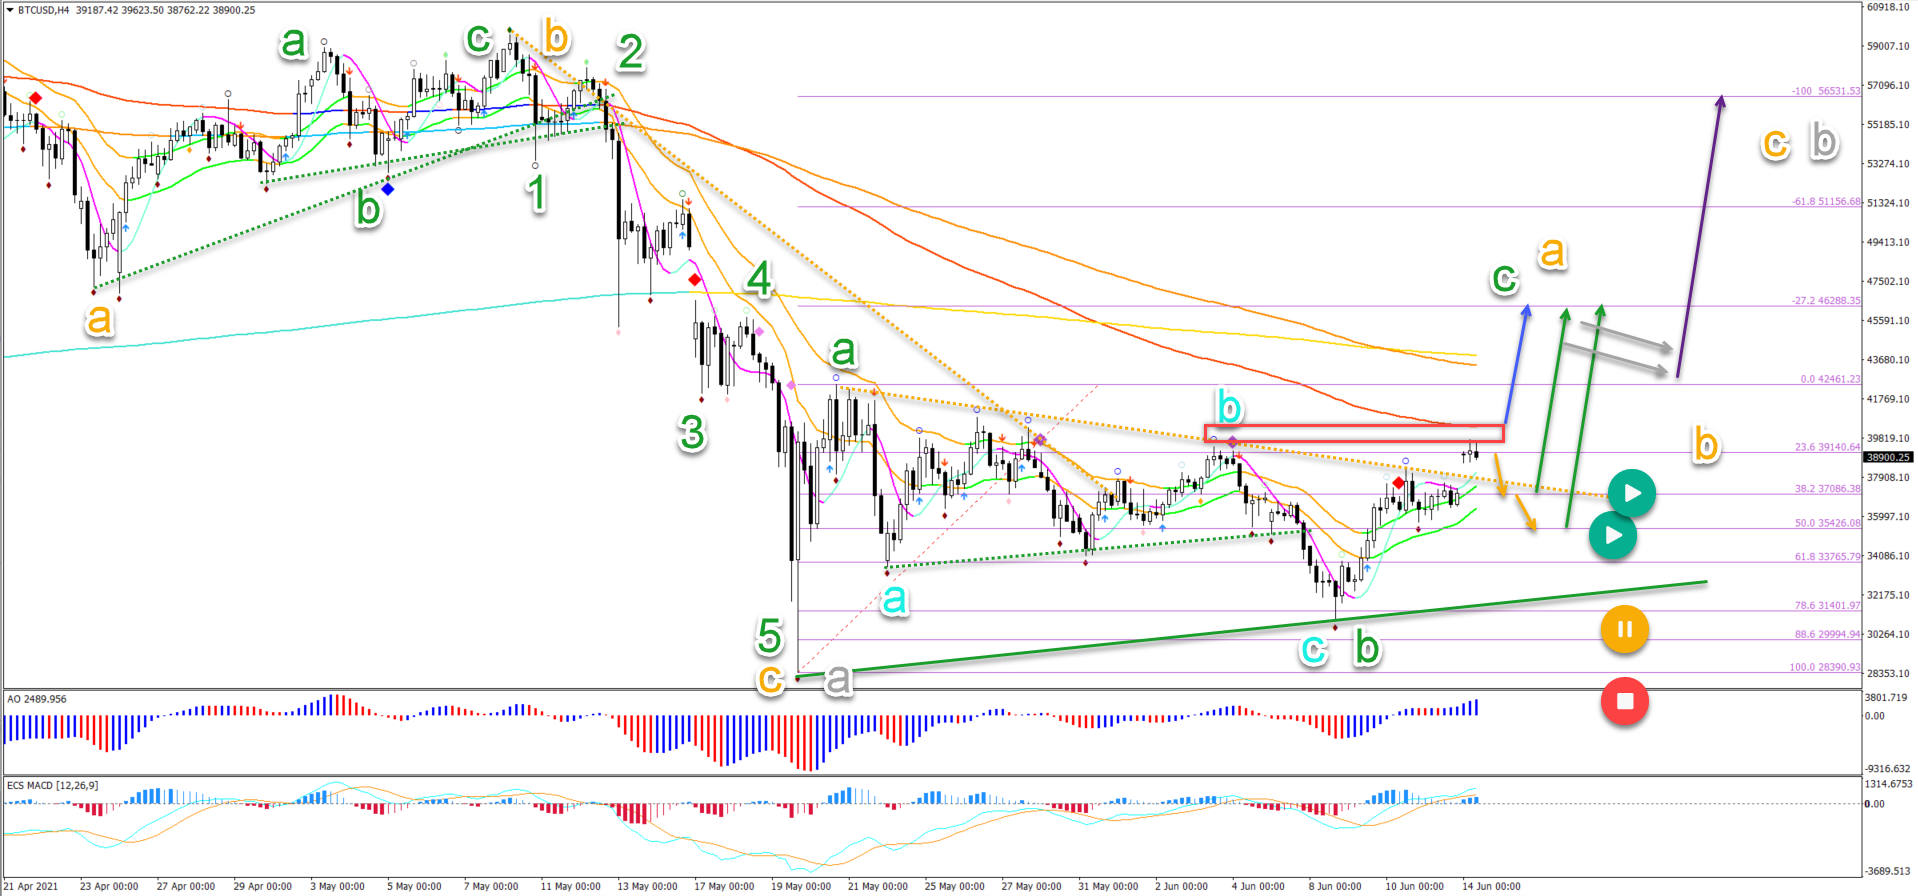
The BTC/USD made a strong bullish reversal after testing the previous bottom and Fibonacci retracement levels:
- The bullish reversal is probably part of a ABC (green) wave or even a potential 123.
- Price action managed to break above the resistance trend line (dotted orange) during the weekend.
- But price action still faces hefty resistance (red box) from the previous top and long-term moving averages.
- A bearish bounce (orange arrows) could retest the support again where a bullish bounce is expected (green arrows).
- A bullish breakout (blue arrow) could indicate an immediate push up. A bull flag pattern (grey arrows) could indicate even more upside (purple arrow).
- A break below the support line (green) places it on hold (orange circle) and a break below the bottom invalidates it (red circle).
On the 1 hour chart, price action is showing strong bullish momentum:
- A 5 wave pattern (black 1-5) seems to be visible.
- The bullish 5 waves could complete a wave 1 (blue).
- A bearish ABC (black) could indicate a wave 2 (blue).
- The Fibonacci retracement levels of wave 2 could act as support (blue arrows).
- Especially the support zone (green box) could indicate a bounce due to the inverted head and shoulders pattern.
- All Fibonacci levels are potentially support levels.
- A break below the 88.6% Fib makes it less likely (orange circle) whereas a break below the bottom invalidates it (red circle).
(Click on image to enlarge)




Comments
Log in or sign up to join the conversation.