

After a three-week pullback from its recent highs, Bitcoin kicked off October with a powerful rally above several key resistance levels. Here’s where the top cryptocurrency may be headed next…
The return of bullish momentum was a welcome change to several weeks of choppy, mostly sideways price action.
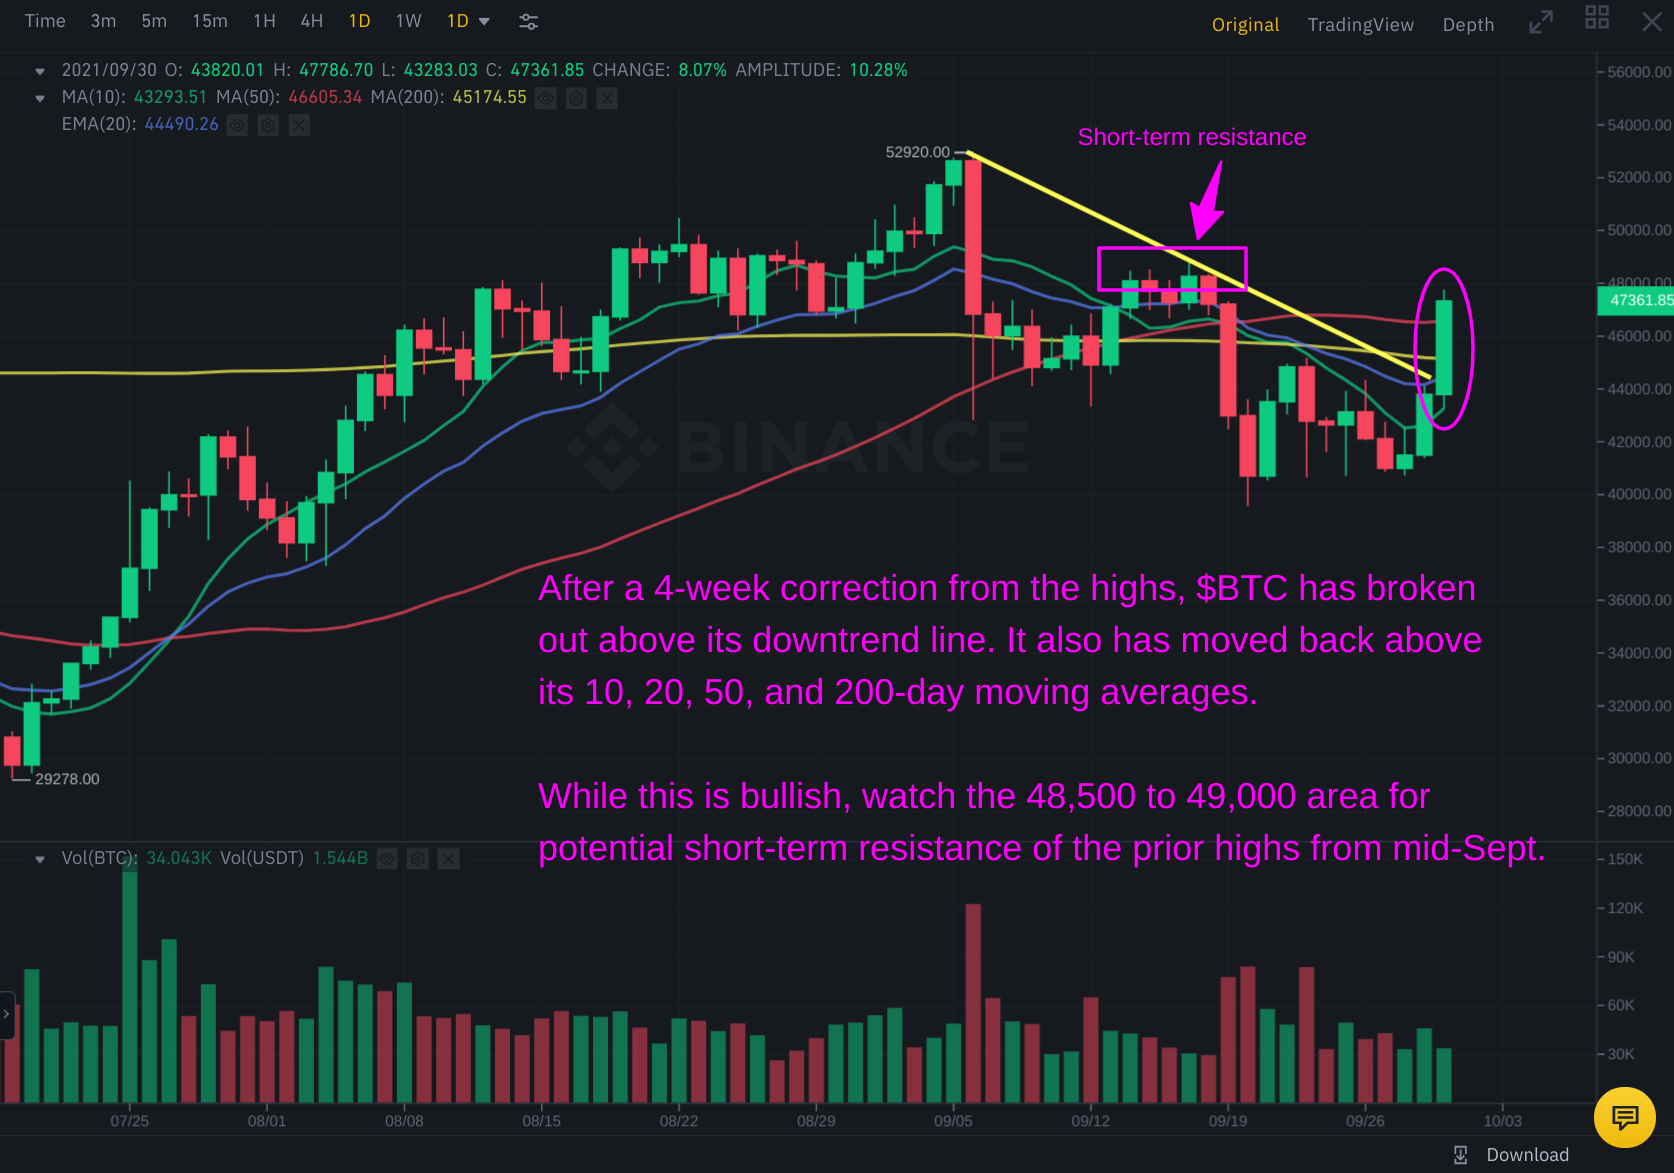
Most notably, Bitcoin’s rally today (October 1) enabled the BTC to break out above pivotal resistance of its downtrend line from the September 6 high.
The BTC breakout also enabled it to move back above its 10, 20, 50, and 200-day moving averages that were former resistance levels:
After ten days of sideways consolidation, pent-up buying pressure from today’s technical breakout could propel Bitcoin significantly higher in the coming days.
Fundamentally, it’s quite bullish that even the recent news of China banning Bitcoin (for the 69,420th time) can not hold back the king of crypto!
Moreover, the month of October is historically quite bullish for Bitcoin.
BTC – A dip to short-term support could provide a low-risk pullback entry
If Bitcoin sees minor selling pressure in the coming days, look for BTC to first find support at the $46,650 area (50-day MA).
Below that, the $45,100 area is more significant support of both the 200-day MA and prior highs of the past week’s trading range (remember that prior resistance becomes new support–after the resistance is broken).
A pullback to this $45,100 level may provide a lower-risk entry point if you are looking for a short to intermediate-term buy entry in BTC.
Watch the price action as Bitcoin approaches overhead resistance levels
Short-term overhead resistance may be found in the $48,500 to $49,000 range (prior highs from mid-September), which could lead to a bit of price consolidation or pullback as described above.
If BTC breaks out above that range, it will create a significant “higher high” on the daily chart, which would provide additional confirmation that the bulls are back in charge.
Beyond the $49,000 area, Bitcoin will need to contend with significant resistance around the $52,500 to $53,000 area (prior highs from September 6).
A high volume rally above the $53,000 level could easily spark a BTC rally to test its all-time high (just below $65,000).
As always, look for higher volume on the “up” days (accumulation) to confirm the rally.
If higher volume does not accompany any rally, then we must always be on guard for a potential reversal back down.
Although many cryptos trade independently of Bitcoin’s direction, we still use BTC as an overall “index proxy” of the overall crypto market’s health–just as the Nasdaq is a popular proxy for gauging overall tech stock performance.


Comments
Log in or sign up to join the conversation.