
Bitcoin (BITCOMP) has been testing the previous top around $19,000 for 10 daily candles in a row. But so far, the bulls have not succeeded to break it.

Image Source: Pixabay
Will price be able to break above the key resistance? Or is the uptrend over and ready for a reversal?
Price Charts and Technical Analysis
(Click on image to enlarge)
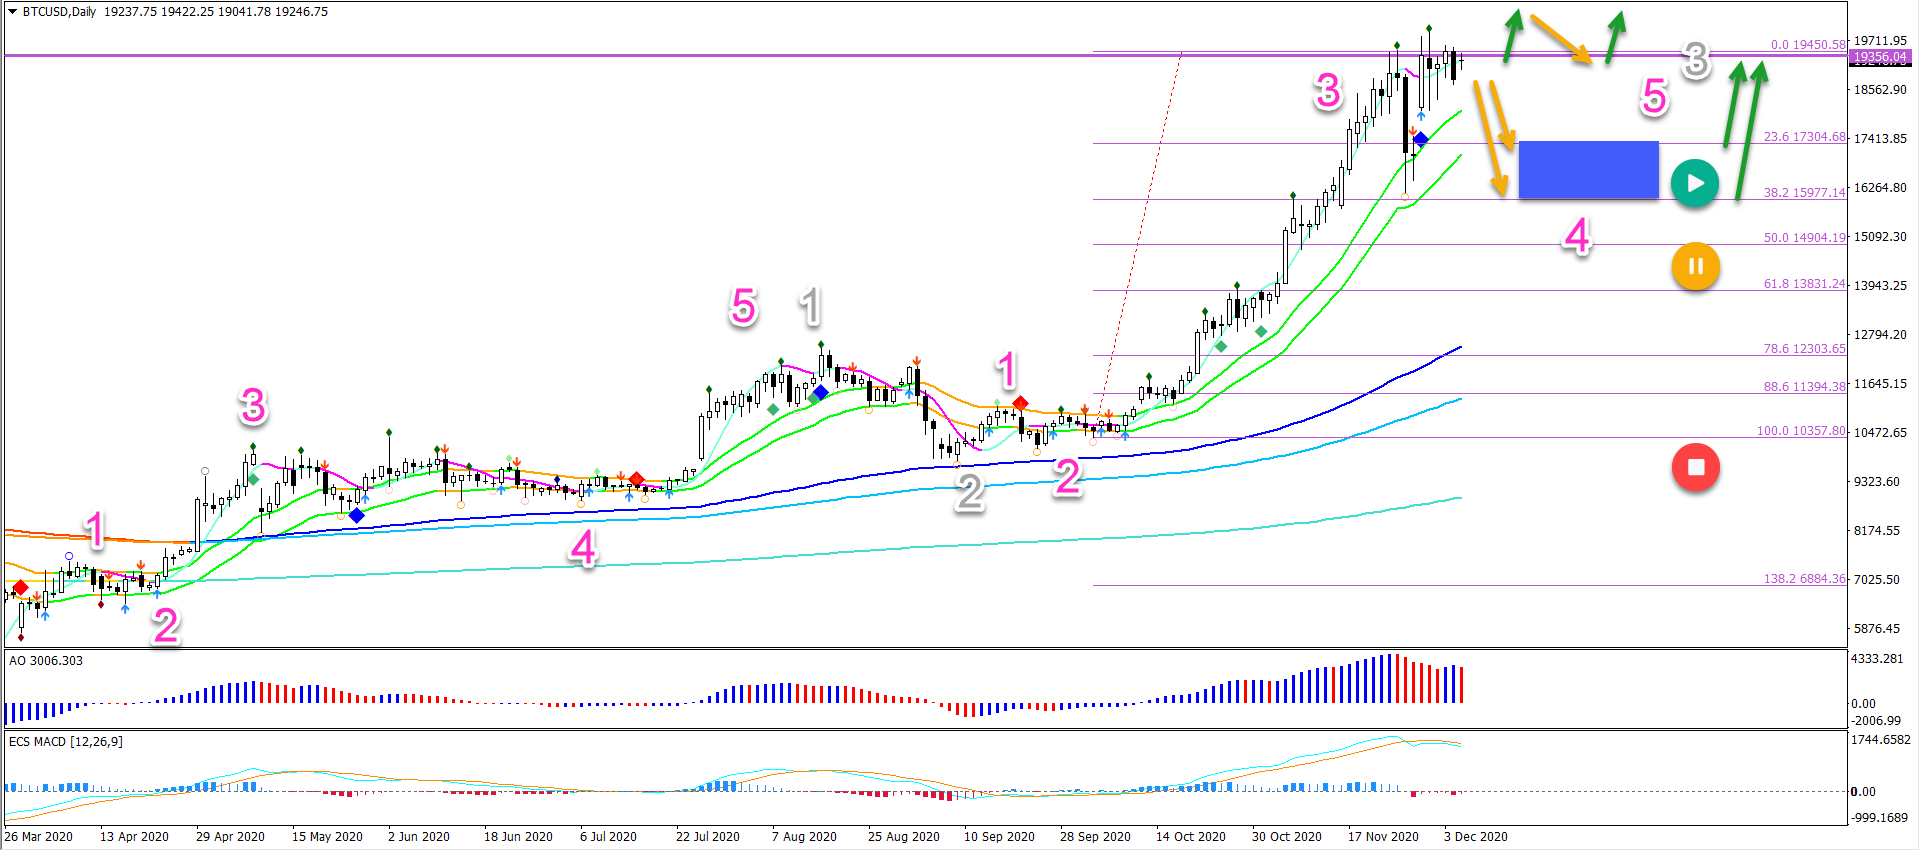
The BTC/USD’s hesitation to break could indicate an extended wave 4 (pink). In that case, price action is expected to test the shallow Fibonacci retracement levels.
A bullish bounce is expected at those Fibs and support zone (blue box). This is a significant confirmation… Why?
- Because it would indicate the development of a larger wave 3 (grey) and uptrend continuation.
- A break below the 50% Fibonacci level would pause (yellow circle) the trend temporarily and a very deep reversal would invalidate it (red circle).
The other likely scenario is an immediate breakout above the previous top. In that case, it would be good to see a break, pullback and continuation. This pattern helps avoid false breakouts. Plus there is also a round level resistance at the $20,000 mark.
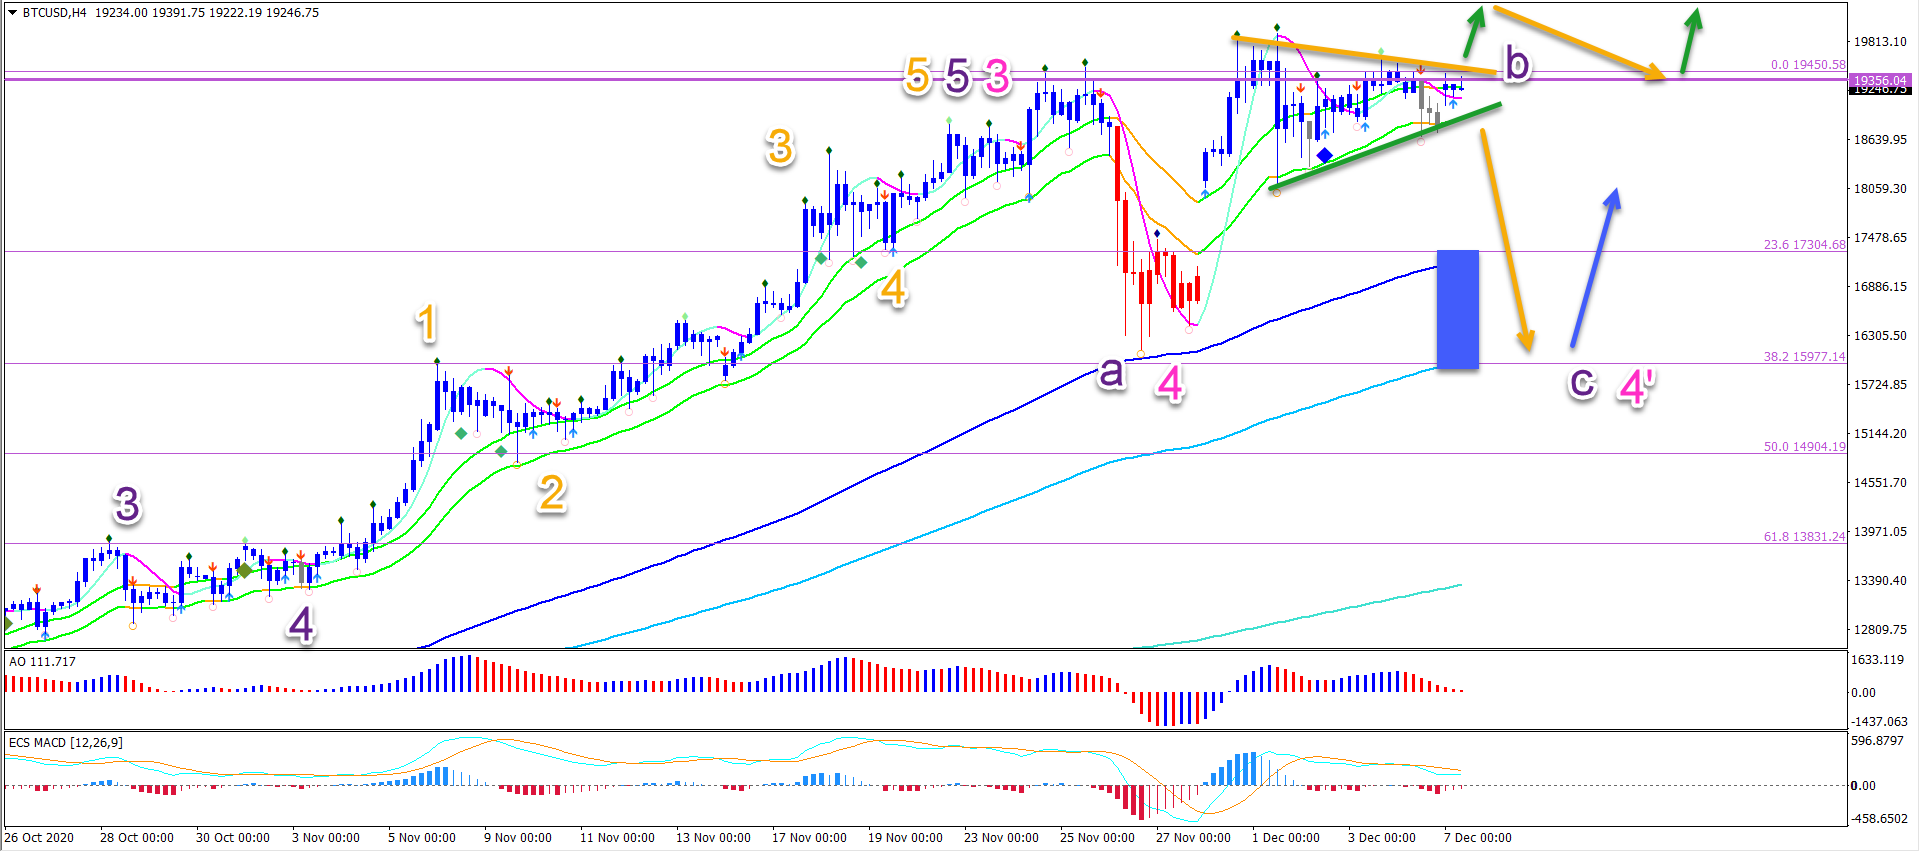
On the 4 hour chart, a break below the support trend line (green) confirms the extension of the wave 4 (pink 4’). The pattern is then completing a bearish ABC pattern (purple).
A bullish breakout should see a break, pullback, and continuation pattern. Otherwise the break remains vulnerable to a deeper retracement.
(Click on image to enlarge)


Comments
Log in or sign up to join the conversation.