

(Click on image to enlarge)
Does history at important junctures ever repeat itself exactly? Nope
Do look-alike patterns take place at important price points? Yup
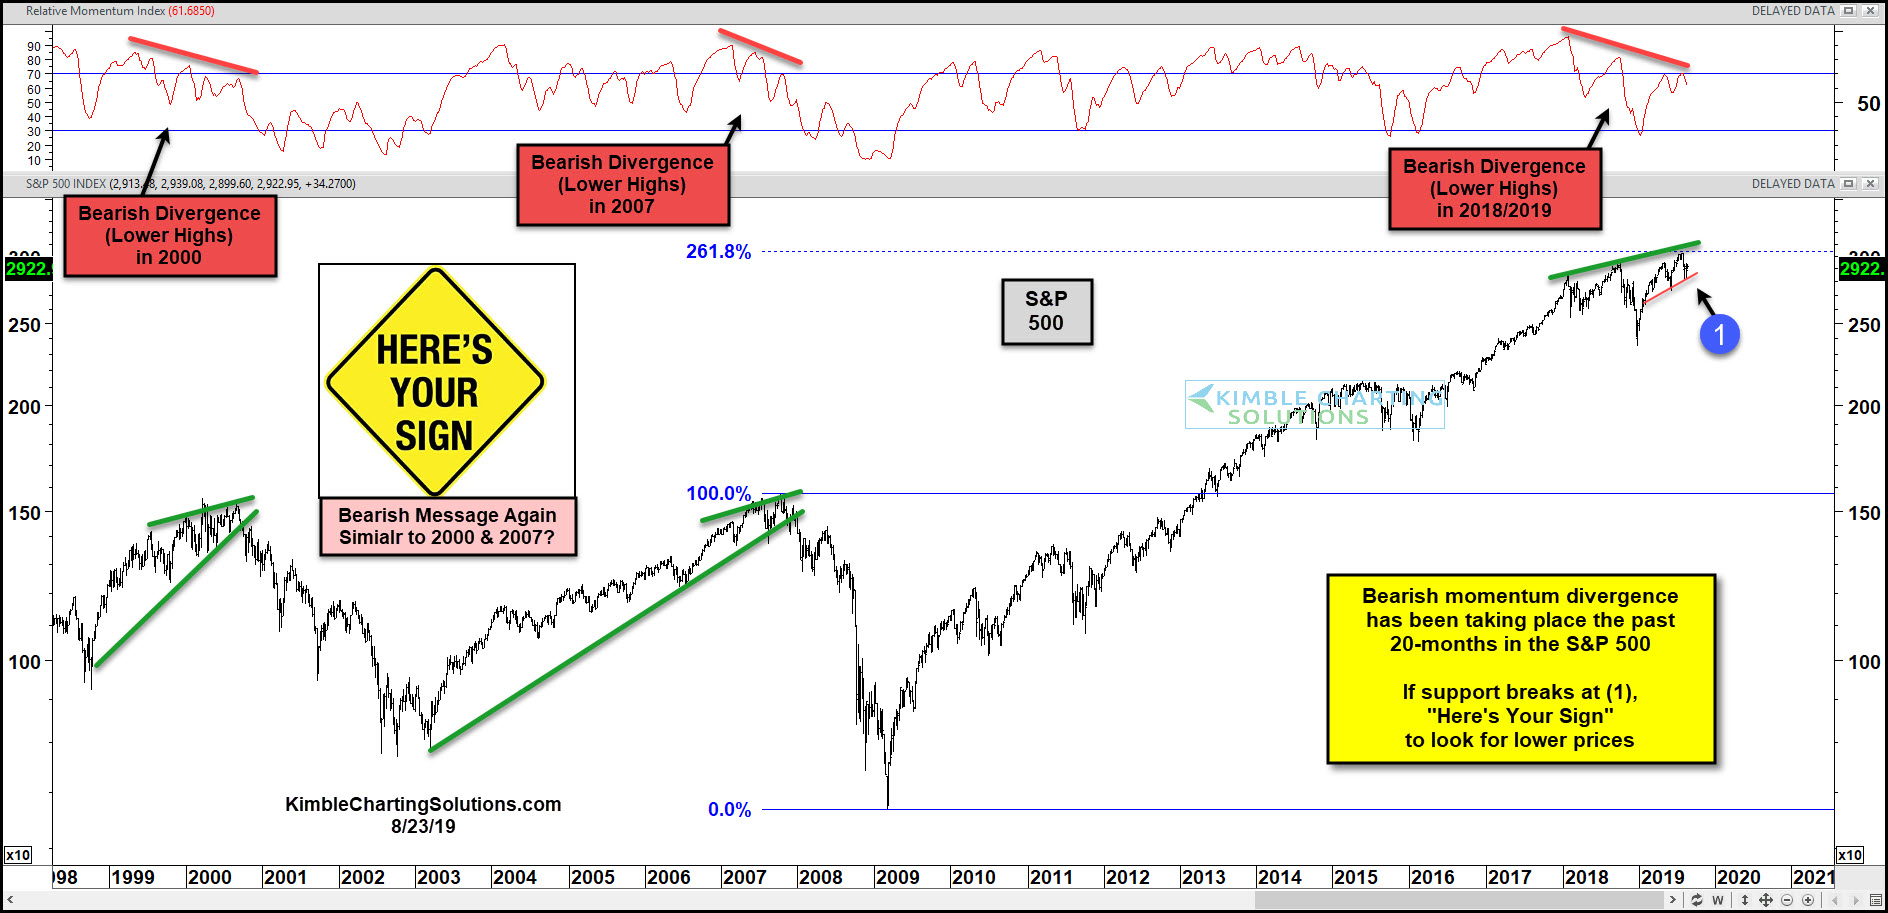
This chart looks at the S&P 500 over the past 20-years.
In 2000 and 2007 bearish momentum divergences took place months ahead of the actual peak in stocks.
Currently, momentum has created a bearish divergence to the S&P 500 for the past 20-months, as the seems to have stopped on a dime at its 261% Fibonacci extension level of the 2007 highs/2009 lows.
Joe Friday Just The Fact Ma’am; A negative sign for the S&P 500 with the divergence in play, would take place if support breaks at (1).



Comments
Log in or sign up to join the conversation.