


Quick answer: Barrick Mining Corporation's (GOLD) daily chart (updated 13 Oct 2026) shows a five-swing decline from the 28 Jan 2026 high, with further downside toward the $30.55 area still possible. A larger WXY double three (often counted as a seven-swing correction) is one way to frame the broader path if structure keeps developing. That is a wave-count scenario, not a finished label. Gold adds context; Barrick’s own chart still needs its own count, invalidation, and updates.
Key question this guide answers: Is Barrick’s pullback from the January high still open to more downside, and when would a seven-swing WXY framing make sense?
Key Takeaways
Five swings down from the 28 Jan 2026 high keep the $30.55 area in view on the daily chart (price near $40.83 on the 13 Oct 2026 update).
A WXY is a double three: two corrective legs (W, Y) joined by X, commonly counted as seven swings.
Five swings alone do not prove a complete WXY. The larger structure still has to form and be confirmed.
Fibonacci watch zones on the chart include about $37.69, $34.96, $30.55, and $26.14. They are reference levels, not promises.
Gold is backdrop, not a one-to-one proxy. Count Barrick on Barrick.
Barrick Mining Elliott Wave: What the Daily Chart Shows
Barrick Mining Corporation’s daily chart presents a bearish Elliott Wave scenario: the decline from the January 28, 2026 high has formed five swings, with further downside toward the $30.55 area remaining possible. A larger corrective pattern to watch is a WXY double three, commonly described as a seven-swing correction.
This is a wave-count scenario, not a certainty. The chart shows the five-swing decline and projected price levels, but it does not label a complete WXY pattern. The larger structure would need to develop and be confirmed by subsequent price action.
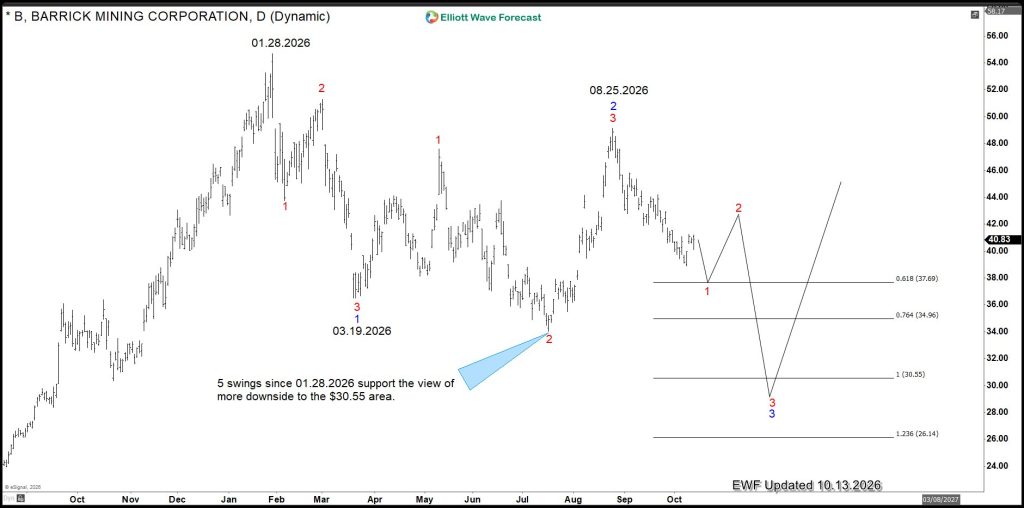
The projected path allows for an interim move toward the $37.69 area, a rebound near $42.50, and then another decline. The chart also marks Fibonacci reference levels at $37.69, $34.96, $30.55 and $26.14. These are potential areas to watch within the illustrated count, not assurances that price will reach or reverse at any specific level.
The five-swing decline is not, by itself, proof that the entire correction is a WXY. It may be a smaller part of a larger corrective sequence. The WXY interpretation would need to fit the broader sequence of swings as it unfolds, with an alternate count and invalidation level kept in view.
Elliott Wave Theory: Reading the Market’s Structure
Elliott Wave Theory, developed from the work of R. N. Elliott, organizes price movements into motive and corrective patterns. In a typical motive sequence, price advances or declines in five waves, 1, 2, 3, 4 and 5, in the direction of the larger trend. A correction moves against that trend and may take the form of an ABC zigzag, a flat, a triangle, or a more complex combination such as WXY or WXYXZ.
For the live theory hub, see Elliott Wave Theory Explained (2026). For WXY vs ABC in more depth, see WXY Structure (Double Three) vs ABC.
Wave rules help test an impulse count. Wave 2 cannot retrace beyond the start of wave 1; wave 3 cannot be the shortest of waves 1, 3 and 5; and in a standard impulse, wave 4 generally does not overlap wave 1. Diagonals can differ from the usual wave 4 non-overlap guideline.
Fibonacci retracements can help estimate where waves 2 or 4 may end. Fibonacci extensions can help project possible reaches for waves 3, 5 or C. Elliott Wave Forecast also uses clusters of Fibonacci levels to identify Blue Box reaction zones, areas to monitor for a possible market reaction, not guaranteed turning points.
Why Count 3, 7 or 11 Swings?
Elliott Wave Forecast applies a swing-based approach to corrective price action. Instead of assuming every pullback is a simple three-swing ABC correction, analysts track how many swings have formed and ask whether the correction may be complete, or still extending. The framework commonly looks for corrections that develop in 3, 7 or 11 swings. A simple ABC is typically three swings; a double three (WXY) is commonly counted as seven; and a triple three (WXYXZ) can extend the correction to eleven.
The count is considered alongside the larger trend, the internal wave structure, Fibonacci relationships and invalidation levels. If the price action remains corrective and overlapping after three swings, the analysis may allow for additional swings before treating the correction as complete. This can help avoid labeling a pullback finished too early.
The 3-7-11 framework is a way to organize and evaluate a developing pattern. It does not mean that every correction must reach eleven swings, or that a particular count cannot change as new price data arrives.
Framework | Typical swings | What it usually means |
|---|---|---|
ABC | 3 | Simple correction; often ends sooner if structure completes cleanly |
WXY (double three) | 7 | Two corrective sections plus connector X; choppier, more extended |
WXYXZ (triple three) | 11 | Longer complex correction when price keeps overlapping and failing to trend |
How a WXY Can Form a Seven-Swing Correction
A WXY, also called a double three, combines two corrective sections, W and Y, with an intervening connector, X. The overall move is commonly described as seven swings. The W, X and Y sections are themselves corrective in character, often with three-wave subdivisions, which can make the complete pattern choppy and more extended than a simple ABC zigzag.
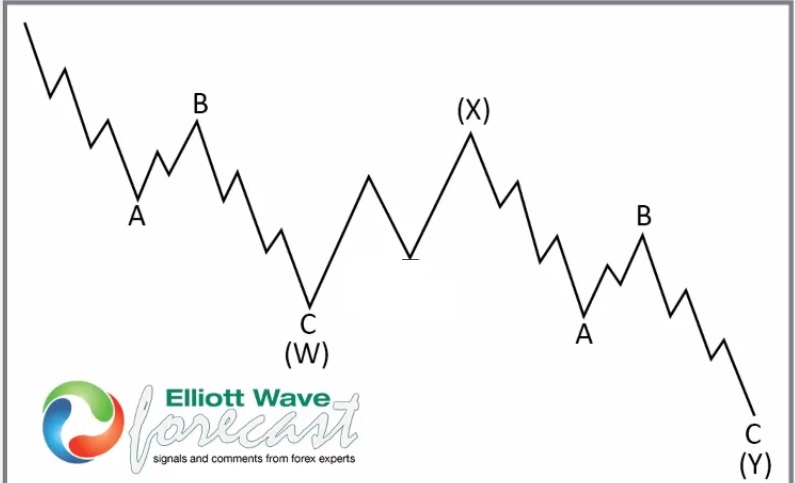
The labels W, X and Y describe the larger parts of the combination; the visible turns inside those parts make up the swing sequence. A chart may contain smaller subdivisions, so the count can look more complex than a basic diagram.
Where Gold Fits
Gold is an important market backdrop for Barrick, but Barrick’s share price does not simply mirror the price of gold. The gold chart can add context to the analysis, while Barrick’s own chart should be counted independently. If both charts show corrective structures, that does not automatically confirm that they share the same wave count or timing.
The chart provided here supports a technical scenario for Barrick only. A specific Elliott Wave count for gold would require its own chart and price levels.
What to Watch Next
For now, the central message from Barrick’s chart is that the five-swing decline from the January high keeps the $30.55 area in view. The route could include rebounds and pauses, and the marked Fibonacci levels offer reference points for evaluating that path.
A WXY remains a possible way to frame a broader seven-swing correction, but it is a developing interpretation rather than a confirmed label. As new price action arrives, the count should be reassessed against the larger trend, the 3-7-11 swing framework and the relevant invalidation level.
Elliott Wave Forecast builds on the original Elliott Wave principles with a swing-counting approach designed to make complex corrections easier to track. A traditional ABC count can describe a simple three-swing correction, but markets may continue into a seven-swing WXY or an eleven-swing WXYXZ pattern. By watching for these possible extensions, we can avoid assuming a correction is complete too soon and keep the larger trend, Fibonacci zones, alternate counts and invalidation levels in view. We see this as a more practical way to apply Elliott Wave analysis to today’s market action, not a replacement for Elliott’s foundational theory or a guarantee of better results.
Conclusion
Barrick’s chart shows a five-swing decline from the January 2026 high, keeping the $30.55 area in focus. A broader WXY correction is one possible way to understand how the move could continue, while gold provides additional market context to assess separately. Elliott Wave Forecast’s 3-7-11 swing approach helps track whether a correction may be complete or still developing. The count remains a scenario: watch how price responds around the chart’s marked levels and reassess if the structure or invalidation point changes.
FAQ: Barrick Mining and WXY Corrections
Is Barrick Mining in a WXY correction right now?
Not as a confirmed label. The daily chart (updated 13 Oct 2026) shows a five-swing decline from the 28 Jan 2026 high, with further downside toward the $30.55 area still possible. A larger WXY (double three) is one way to frame a seven-swing correction if the structure keeps developing. It is a scenario, not a finished count.
What is a seven-swing WXY correction?
A WXY, or double three, combines two corrective sections (W and Y) with a connector (X). The overall move is commonly counted as seven swings. It is usually choppier and more extended than a simple three-swing ABC zigzag.
Does Barrick move one-for-one with gold?
No. Gold is important context for a gold miner, but Barrick’s share price should be counted on its own chart. Shared corrective character on both charts does not prove the same wave count or timing.
What levels matter on the Barrick daily chart?
As of the 13 Oct 2026 update, Barrick was near $40.83. The chart marks Fibonacci reference areas at about $37.69, $34.96, $30.55, and $26.14, with a possible interim path that includes a move toward $37.69, a rebound near $42.50, then further decline. These are watch levels inside the illustrated count, not guarantees.



Comments
Log in or sign up to join the conversation.