
Yes, it’s all quite maddening for many rational investors as bad news morphs to become great news.
Yet this has been going on for nearly 7 years as bulls don’t care about anything beyond keeping interest rates at zero for as long as possible.
Thursday we noted Goldman Sachs had indicated a rally would need two things; first, better earnings than expected but second, more stock buybacks. The latter is what matters for bulls since buybacks financed by cheap credit (ZIRP) are the fuel that persuades corporate chieftains to do it. Earnings look much better on fewer shares. Sure, they don’t reinvest in the company’s long term growth by doing this, but shareholders benefit in the short-term. Further, corporate insiders have lucrative stock options to enrich them. This goes directly to the “income inequality” refrain we hear so much about.
Friday the Employment Report laid an egg. Only 142K new jobs created vs 203K expected, and prior amazingly declined from 173K to only 136K. (Most new jobs were waiters, bartenders and part timers.) The joke's that the unemployment rate only 5.1%. All those not working for whatever reason aren't counted anymore.
The Fed chimed in lamely to assert there are many who just don’t want to work. Why would that be? Maybe it’s easier to coast along enjoying other government benefits. To complete the bad news were Factory Orders which also sucked and blowed, down -1.7% vs prior 0.02%. So much for that “solid” economic growth, Janet.
With the early bad news, stocks dropped sharply but the bad news bulls quickly jumped in for the “stick save” believing the previous 7 years of permanent “dip buying” was still intact. The Dow, for example, rose 200 points off the intraday low of more than 200 point early drop.
Emerging Markets also rallied on the belief no interest rate increases are in the offing, as did Europe and other overseas markets. It also shouldn’t surprise that long-term bond prices also rose as yields fell.
For us, we’ll just keep following what the tape tells us what to do by staying disciplined and systematic.
Market sectors moving higher included: Everything.
Market sectors moving lower included: Volatility (VIX).
The top ETF daily market movers by percentage change in volume whether rising or falling is available daily.
Volume was heavy given the “bad news is good” theme as investors jumped in with both hands to close the week positively. Breadth per the WSJ was 90/10 positive overall.

Charts of the Day
Major U.S. Markets (7)
U.S. Market Sectors & ETFs (8)
Bonds (2)
Commodity & Currency ETFs (9)
International & Emerging Market ETFs (3)
$NYMO (1)
$NYSI (1)
$VIX (1)
-
SPY 5 MINUTE

-
SPX DAILY

-
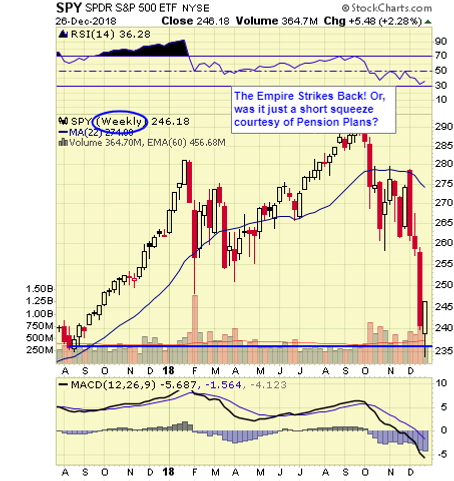
SPX WEEKLY

-
INDU DAILY

-
INDU WEEKLY

-
RUT WEEKLY

-
NDX WEEKLY

-
XLB WEEKLY

-
XLE WEEKLY

-
XLF WEEKLY

-
XLI WEEKLY

-
IBB WEEKLY

-
XRT WEEKLY

-
IYT WEEKLY

-
XLU WEEKLY

-
HYG WEEKLY

-
TLT WEEKLY

-
UUP WEEKLY

-
FXY MONTHLY

-
FXE WEEKLY

-
GLD MONTHLY

-
GDX MONTHLY

-
SLV MONTHLY

-
DBB MONTHLY

-
USO MONTHLY

-
DBC MONTHLY

-
EFA WEEKLY

-
IEV WEEKLY

-
EEM WEEKLY

-
NYMO DAILY

The NYMO is a market breadth indicator that is based on the difference between the number of advancing and declining issues on the NYSE. When readings are +60/-60 markets are extended short-term.
-
NYSI DAILY

The McClellan Summation Index is a long-term version of the McClellan Oscillator. It is a market breadth indicator, and interpretation is similar to that of the McClellan Oscillator, except that it is more suited to major trends. I believe readings of +1000/-1000 reveal markets as much extended.
-
VIX WEEKLY

The VIX is a widely used measure of market risk and is often referred to as the "investor fear gauge". Our own interpretation is highlighted in the chart above. The VIX measures the level of put option activity over a 30-day period. Greater buying of put options (protection) causes the index to rise.
As usual, the tape action is doing all the talking. Clearly Friday’s rally was impressive in breadth and scope coming off bearish lows. It almost is similar to the reaction when the Fed cut interest rates in 1982 launching the great bull market that ensued.
Goldman Sachs was probably correct in asserting a more durable rally could follow if stock buybacks can continue given low interest rates and earnings improve starting next week.
I’m no fan obviously, but I’ll still follow the dictates of the tape.
Let’s see what happens.


Comments
Log in or sign up to join the conversation.