

With October industrial production reported November 17, we have this picture of the NBER Business Cycle Dating Committee‘s key indicators:
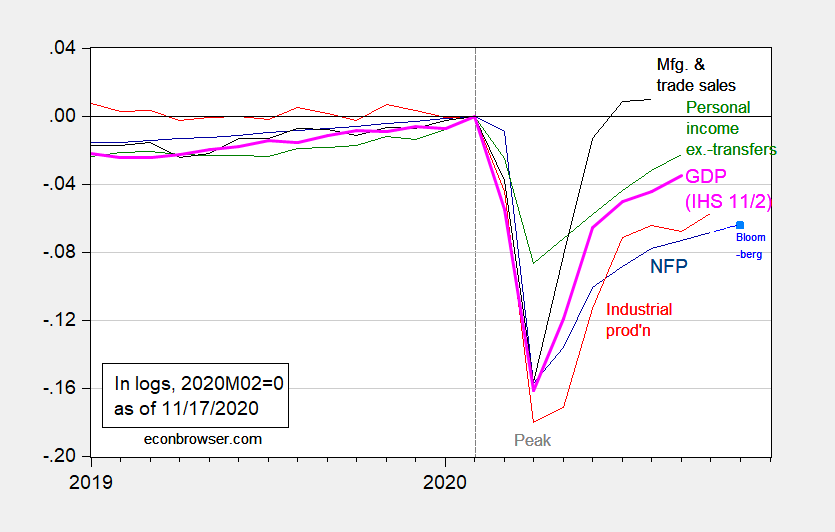
Figure 1: Nonfarm payroll employment (dark blue), Bloomberg consensus for employment as of 11/17 (light blue square), industrial production (red), personal income excluding transfers in Ch.2012$ (green), manufacturing and trade sales in Ch.2012$ (black), and monthly GDP in Ch.2012$ (pink), all log normalized to 2020M02=0. Source: BLS, Federal Reserve, BEA, via FRED, Macroeconomic Advisers (11/2 release), NBER, Bloomberg, and author’s calculations.
Industrial production rose 1.1% (not annualized) much in line with Bloomberg’s consensus 1.0%. Hence for data through October (September for monthly GDP, and August for sales), we have evidence of continued growth.
Retail sales, also reported today, were under consensus. Figure 2 shows retail sales and food services, as well as retail sales, both in nominal terms. Both have slowed their growth, to 3.0% and 3.5% respectively (log terms).
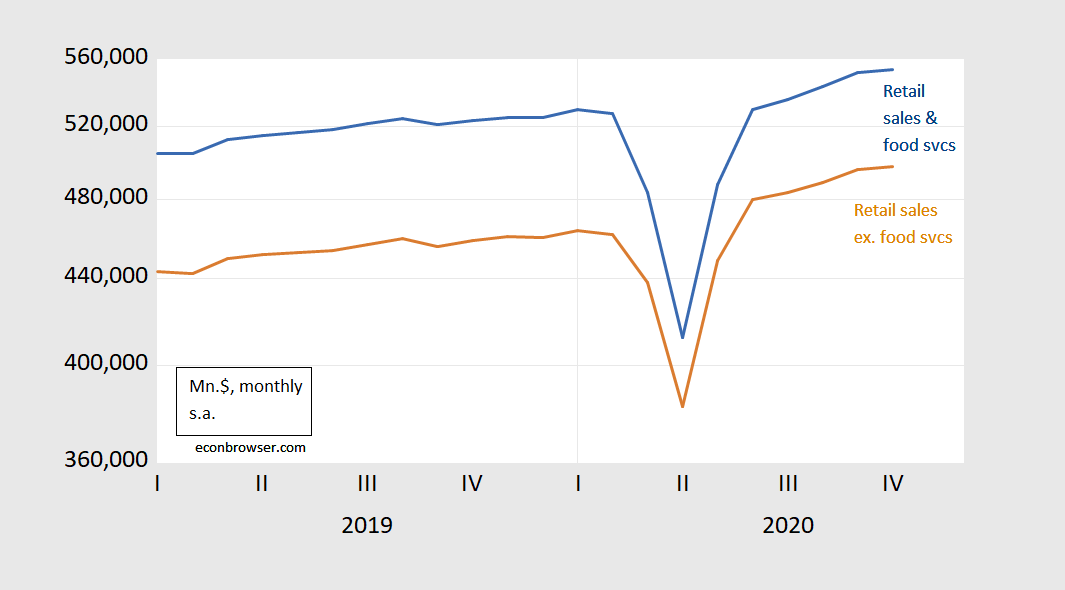
Figure 2: Retail sales and foods services (blue), and retail sales ex. food services (brown), both in millions $, not annualized. Source: BEA via FRED.
Food service sales have slowed to essentially zero growth (-1.5% annualized) far below peak: 16% (log terms). Adjusting by the CPI-food away from home index, the decline is 19% (and declining at an annualized 4.8%).
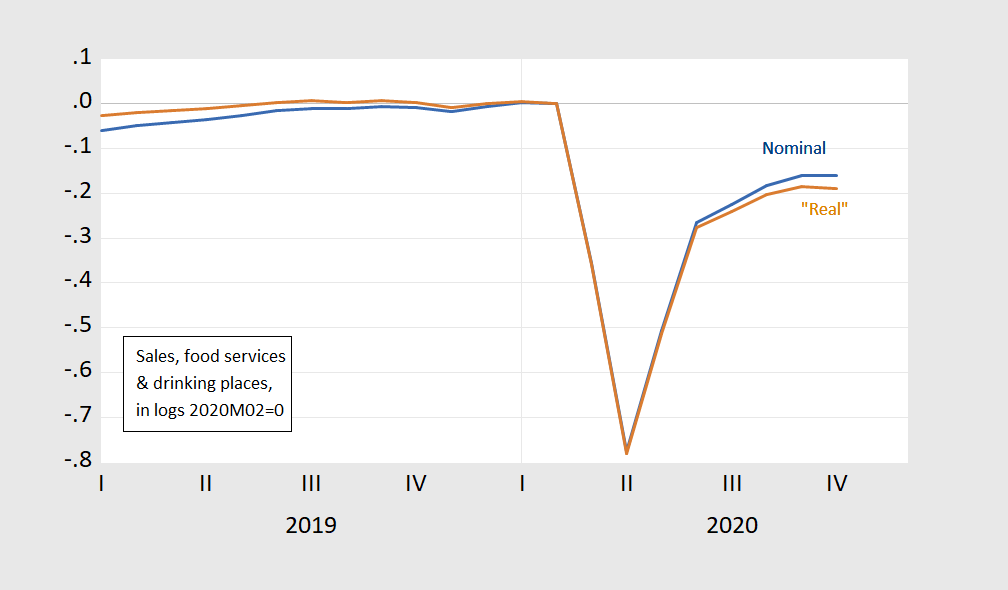
Figure 3: Food services sales (blue), “real” food service sales (brown), both in logs, 2020M02=0. Food service sales deflated by CPI index for urban food away from home. Source: BEA, BLS, author’s calculations.
I expect the food services sector to decelerate in the next monthly employment report, if not actually decline.


Comments
Log in or sign up to join the conversation.