


The Aussie Dollar reversed its course against the Greenback on Tuesday as investors remain uncertain of the outcome of the Middle East conflict, which tends to push energy prices higher, increasing the likelihood that major central banks would need to tighten monetary policy. The AUD/USD trades at 0.7080 after reaching a high of 0.7119.
AUD/USD Reverses as Iran Risks Lift Dollar Before Fed Minutes
The US-Iran conflict is making headlines. Recently, CNN, citing a US official, reported that Trump instructed senior officials to stop talks with Iran. Trump also confirmed that the US Navy blockade is still active, while US data was mixed, with Housing Starts falling short of expectations due to higher mortgage rates and elevated prices.
US housing and industrial production data disappointed traders. Housing Starts fell 12.4% MoM from 1.415 million in June to 1.239 million in July, due to high prices and elevated mortgage rates. At the same time, the Fed revealed that Industrial Production slowed from the expected 0.3% to 0.2% MoM.
In Australia, traders would eye the release of the Wage Price Index for the second quarter, with figures forecast at 0.8%, unchanged from the previous print. Annually, the index is projected to ease from 3.3% to 3.2%.
Meanwhile, Moody’s rating agency affirmed Australia’s creditworthiness at Aaa, maintaining a stable outlook. The agency expects real GDP growth of 1.9% this year and 1.6% in 2027, and added that weak productivity, housing affordability, higher debt and exposure to external shocks are key challenges.
In the US, the economic docket will feature the release of the Federal Reserve’s last meeting minutes.
AUD/USD Price Forecast: Technical Outlook
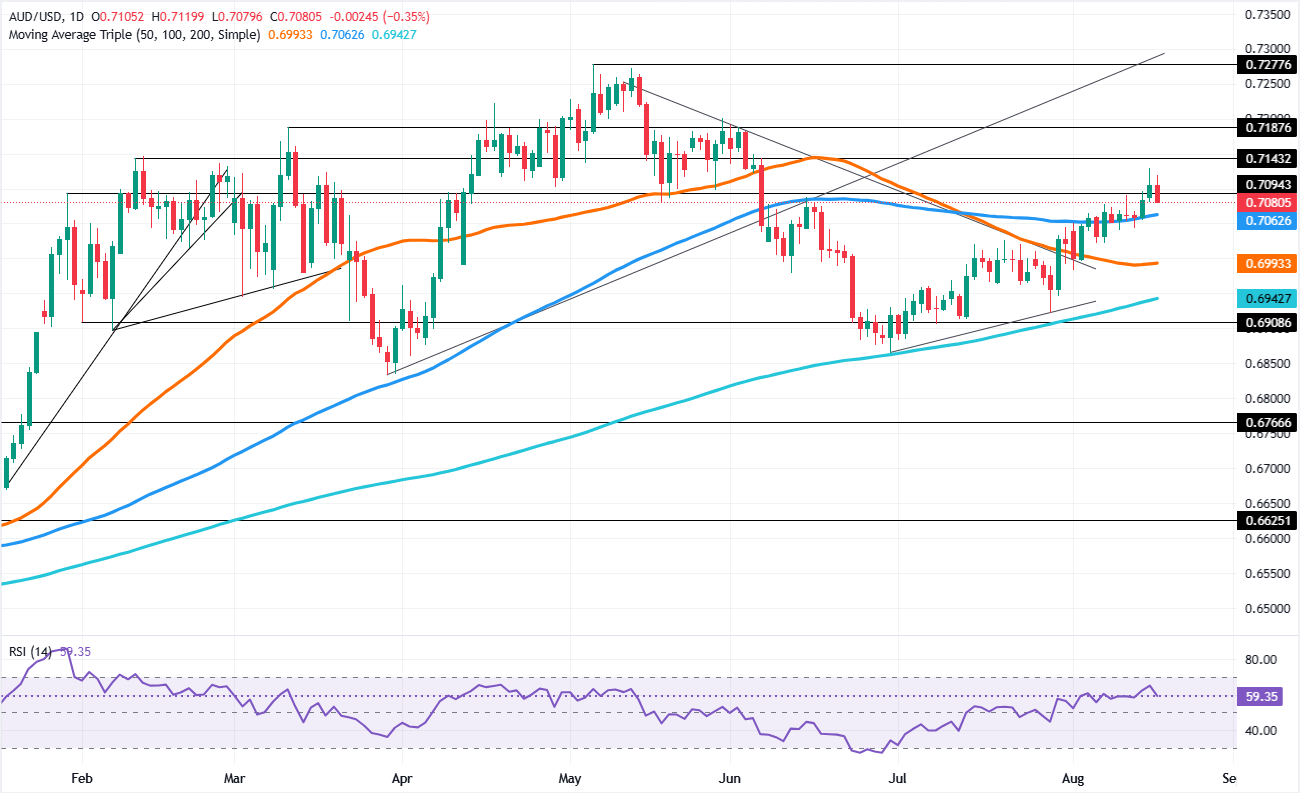
AUD/USD daily chart
In the daily chart, AUD/USD trades at 0.7081, maintaining a mildly bullish near-term bias as spot holds above the 50-day simple moving average (SMA) at 0.6993 and the more recent uptrend support around 0.7058. Price is currently testing a broader ascending trend line derived from the 0.6833 base, reinforcing the 0.7080 area as an immediate pivot, while a firming Relative Strength Index (14) near 59 suggests constructive momentum without yet reaching overbought territory.
On the downside, initial support is eyed at the 0.7081 pivot before 0.7058 and the 50-day SMA at 0.6993, with deeper backing coming from the former downward trend-line break level near 0.6399. On the topside, a sustained move higher would first target the ascending trend-line break zone around 0.7307, ahead of secondary resistance levels at 0.8425 and 0.9139, where prior structural barriers could slow further gains.



Comments
Log in or sign up to join the conversation.