


The Aussie Dollar registered losses of over 0.73% on Monday as sentiment soured due to a fall in technology shares, along with heightened tensions in the Middle East, high energy prices, and a jump in bond yields. The AUD/USD trades at 0.7118, after hitting a high of the day (HOD) of 0.7168.
AUD/USD falls as tech weakness, Oil risks and Fed bets lift Dollar
The leaders of AI companies in the US expressed concerns about the rapid pace of advances in the industry and called for a slowdown. This triggered a leg lower in US equity markets, while the US Dollar – boosted by the US 10-year T-bond yield past 5% - is poised to end Monday’s session up 0.33%, according to the US Dollar Index (DXY).
The DXY, which measures the advance of the American Dollar against its six peers, reclaims the 99.00 level, up 99.46.
Geopolitics are playing a big role, following Yemen’s Houthis attack on a Saudi Oil pipeline, which could be shut for several weeks, triggering a shortage of about 7 million barrels per day. Hence, investors' inflation expectations continued to rise following last week's US inflation data, which pushed traders to price in almost a full rate hike by the Fed.
Money markets had priced in a 97.50% chance for a 25 basis points rate hike at the September 15-16 Fed meeting.
On Monday, the US economic docket was absent, but it would gather pace on Tuesday, with the ADP Employment Change 4-week average.
In Australia, the Aussie Dollar is being pressured by a downbeat mood, which has increased the Greenback’s appeal as a haven. However, the ANZ-Roy Morgan Australian Consumer Confidence is expected, while some Chinese data, such as Retail Sales, could influence AUD/USD, given Australia's status as one of the largest trading partners in the region.
AUD/USD Price Forecast: Technical outlook
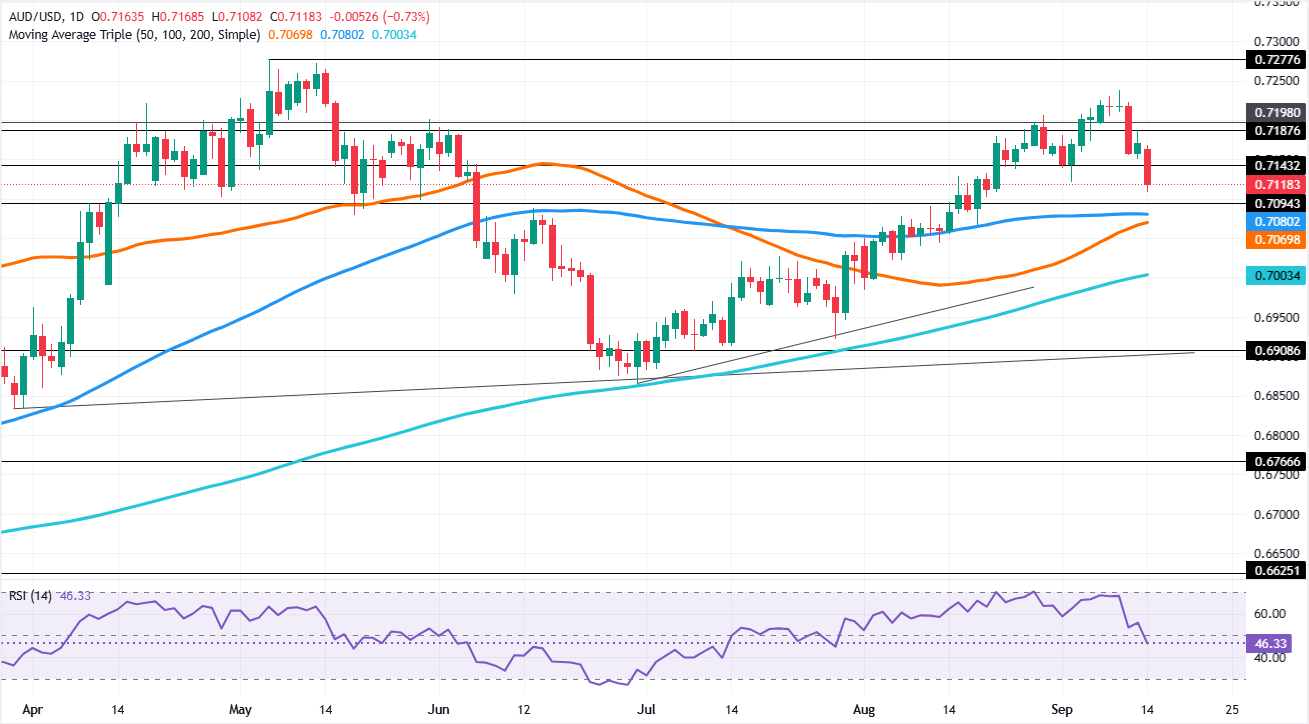
AUD/USD daily chart
In the daily chart, AUD/USD trades at 0.7118, maintaining a mildly bullish near-term bias as it holds above the simple moving average triple at 0.7070 and a series of rising trend-line supports clustered between roughly 0.7028 and 0.6902. The Relative Strength Index (14) has retreated toward 46, hinting at easing upside momentum but not yet signaling a decisive bearish shift while price remains supported by these underlying structural levels.
On the topside, initial resistance is seen at the horizontal barrier near 0.7198, with the upward trend line projected around 0.7364 acting as the next significant cap should bulls extend the advance. On the downside, a move back below the nearby support band formed by the simple moving averages around 0.7070 and the rising trend line at 0.7028 would expose deeper support near 0.6902, while any sustained break lower would leave the prior trend-line break region around 0.6381 as a more distant structural floor.

Comments
Log in or sign up to join the conversation.