


The Australian Dollar began the week on a lower note, trading with a 0.28% loss against the Greenback as risk appetite soured after the US Department of the Treasury imposed sanctions on Iran-linked entities. At the time of writing, the pair trades at 0.7159
AUD/USD weakens as Iran sanctions dent sentiment before inflation data
Wall Street ended Monday’s session in the red, while US Treasury Secretary Scott Bessent embarked on a mission to cut off Iran from the global economy. Aside from this, data in the US revealed that the Chicago Fed’s National Activity Index dipped to -0.08 from 0.06 in July, remaining near the trend level 0 level throughout the year.
The White House, through Bessent, revealed sanctions on Tehran, targeting five areas: digital assets, technology, gold, aviation and shipping. He added that they’re giving a timeline to world leaders to cut ties with Iran, while saying that Trump will speak with countries.
In the meantime, the US economic docket will pick up the pace starting Tuesday, with growth, inflation, and jobs data releases, including the Fed’s favourite inflation gauge, the Core Personal Consumption Expenditures (PCE) Price Index. Aside from this, eyes are on Fed Chair Kevin Warsh's speech at Jackson Hole on August 28.
In Australia, the economic docket will feature the release of the Reserve Bank of Australia’s (RBA) last meeting minutes, while the RBA’s head of domestic markets, David Jacobs, will cross the wires.
After that meeting, money markets had priced in a slim 14% chance that the RBA would raise rates at the September 29 meeting, with odds of holding rates expected to stay at 86%, according to Prime Terminal.
The Aussie economic calendar will feature inflation data on Wednesday, with economists estimating that prices rose 0.8% in July. In the twelve months to July, analysts estimate that inflation eased from 3.8% to 3.2%, while the trimmed-mean Consumer Price Index (CPI) is forecast to drop by a tenth to 3.5%.
AUD/USD Price Forecast: Technical Outlook
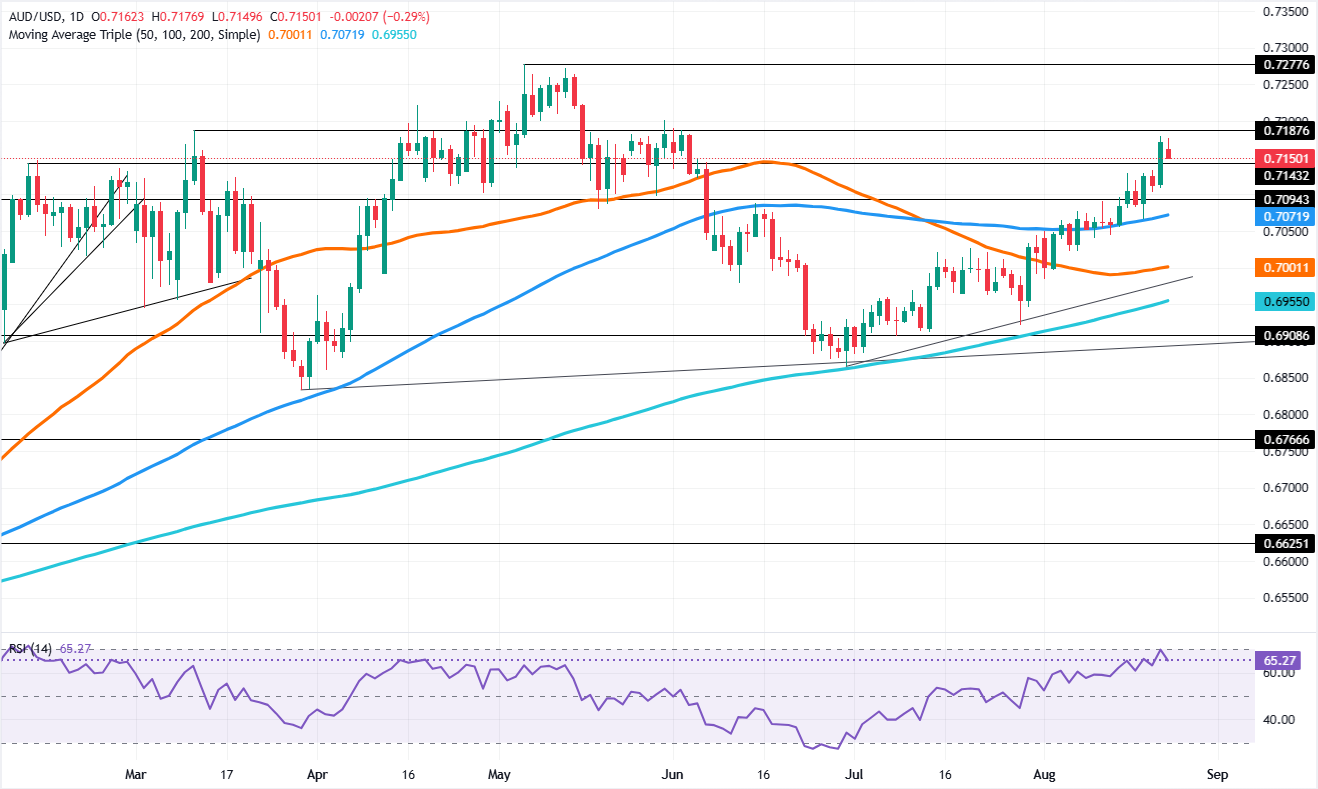
In the daily chart, AUD/USD trades at 0.7150, maintaining a bullish near-term bias as spot holds above the clustered 50-, 100- and 200-day simple moving averages (SMAs) around 0.7001. The pair is also supported by rising trend lines coming in below 0.7000, while the relative strength index (RSI) at 65 suggests firm but not yet extreme upside momentum as price grinds higher within the broader uptrend.
On the topside, initial resistance is seen near the upward-sloping trend barrier around 0.7320, with the longer-term descending trend line from 0.8015 and subsequent broken trend levels at 0.8472 and 0.9208 likely to cap any extended advance. On the downside, immediate support is located at the current price area around 0.7150, ahead of the SMA cluster near 0.7001; a deeper pullback would expose the next structural floors at the rising trend supports around 0.6983 and 0.6894.

Comments
Log in or sign up to join the conversation.