

In this series we scale-back and look at the broader technical picture to gain a bit more perspective on where we are in trend. The Australian Dollar is down more than 1.6% against the US Dollar from the monthly highs with Aussie trading within a critical technical range. These are the updated targets and invalidation levels that matter on the AUD/USD weekly price chart. Review this week’s Strategy Webinar for an in-depth breakdown of this setup and more.
AUD/USD WEEKLY PRICE CHART
(Click on image to enlarge)
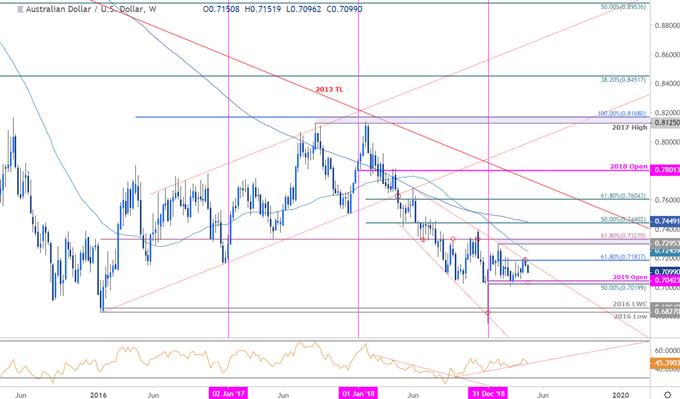
Notes: In my previous AUD/USD Weekly Technical Outlook we noted that, “The broader risk remains weighted to the downside sub-7233 for now, with a break / close below yearly open support needed to mark resumption of the broader downtrend.” Aussie has continued to respect this support zone with price trading within a well-defined range between key technical zones.
Critical support remains at 7020/42 – a region defined by the yearly open, the 50% retracement of the 2019 range and the yearly close-low. A break / close below is needed to mark resumption of the broader down trend exposing the 2016 low / low-week close at 6827/55. Resistance stands with the June trendline / 61.8% retracement of the January decline at 7184 – a breach above this zone would shift the focus back towards the 100-day moving average at 7246 and broader bearish invalidation at 7295-7327.
Bottom line: Aussie is trading within a critical range between 7020-7184 – and we’re looking for the breakout to offer guidance on our medium-term outlook. From a trading standpoint, the immediate risk is lower within this range but look for a reaction on a drop towards yearly open support. I’ll publish and updated AUD/USD Price Outlook once we get further clarity in near-term price action.
AUD/USD TRADER SENTIMENT
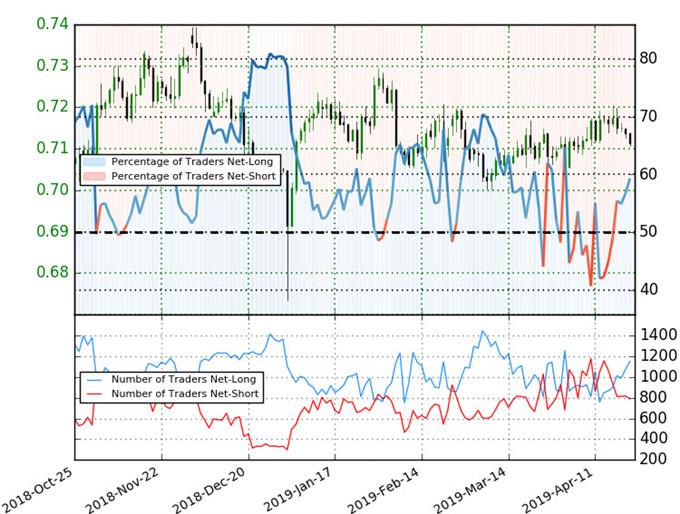
- A summary of IG Client Sentiment shows traders are net-long AUD/USD - the ratio stands at +1.46 (59.3% of traders are long) – weak bearish reading
- The percentage of traders net-long is now its highest since April 1st
- Long positions are 8.3% higher than yesterday and 20.6% higher from last week
- Short positions are 7.5% lower than yesterday and 22.3% lower from last week
- We typically take a contrarian view to crowd sentiment, and the fact traders are net-long suggests Aussie prices may continue to fall. Traders are further net-long than yesterday & last week, and the combination of current positioning and recent changes gives us a stronger AUD/USD-bearish contrarian trading bias from a sentiment standpoint.



Comments
Log in or sign up to join the conversation.