

According to the BLS, the Consumer Price Index (CPI-U) year-over-year inflation rate was 1.7 % year-over-year (lower than the reported 1.8 % last month). The year-over-year core inflation (excludes energy and food) rate grew from 2.2 % to 2.4 % and is above the target set by the Federal Reserve.

Analyst Opinion of the Consumer Price Index
The energy was the main reason for inflation decline. Medical care services cost inflation rose from 3.3 % to 4.3 % year-over-year.
The market expected (from Econoday):
(Click on image to enlarge)
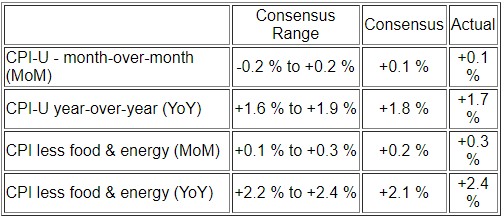
(Click on image to enlarge)

As a generalization - inflation accelerates as the economy heats up, while the inflation rate falling could be an indicator that the economy is cooling. However, inflation does not correlate well to the economy - and cannot be used as an economic indicator.
The major influence on the CPI was energy.
Increases in the indexes for shelter and medical care were the major factors in the seasonally adjusted all items monthly increase, outweighing a decline in the energy index. The energy index fell 1.9 percent in August as the gasoline index declined 3.5 percent. The food index was unchanged for the third month in a row. The index for all items less food and energy rose 0.3 percent in August, the same increase as in June and July. Along with the indexes for medical care and shelter, the indexes for recreation, used cars and trucks, and airline fares were among the indexes that increased in August. The indexes for new vehicles and household furnishings and operations declined over the month. The all items index increased 1.7 percent for the 12 months ending August; the 12-month increase has remained in the range of 1.5 to 2.0 percent since the period ending December 2018. The index for all items less food and energy rose 2.4 percent over the last 12 months, its largest 12-month increase since July 2018. The food index rose 1.7 percent over the last year while the energy index declined 4.4 percent.
Historically, the CPI-U general index tends to correlate over time with the CPI-U's food index. The current situation is putting upward pressure on the CPI.
CPI-U Index compared to the Food sub-Index of CPI-U
(Click on image to enlarge)

Notice the gap in the above graphic between the CPI and Food - historically this gap has always closed when the knock-on effect from higher food prices into other CPI components moderates.
The graphs below compare health care to the CPI-U.
Month-over-Month Change CPI-U Index (red line) compared to the Medical Care sub-Index of CPI-U (blue line)
(Click on image to enlarge)

Year-over-Year Change CPI-U Index (red line) compared to the Medical Care sub-Index of CPI-U (blue line)
(Click on image to enlarge)

The Federal Reserve has argued that energy inflation automatically slows the economy without having to intervene with its monetary policy tools. This is the primary reason the Fed wants to exclude energy from analysis of consumer price increases (the inflation rate).
(Click on image to enlarge)

In the above chart - the green boxes are significant elements moderating inflation, while the red boxed items are significant elements fueling inflation.
The graph below looks at the different price changes seen by the BEA in this PCE release versus the BEA's GDP and BLS' Consumer Price Index (CPI).


Comments
Log in or sign up to join the conversation.