


The Australian Dollar tumbles for the third straight day against the US Dollar as market sentiment turns sour amid a possible escalation of the conflict amid doubts for a ceasefire agreement between the US and Iran. The AUD/USD trades below 0.6900, down 0.76%.
Aussie slides amid rising geopolitical tensions, high Oil prices, and a firm US Dollar
Geopolitics are setting the tone in the financial markets amid growing pessimism that the US and Iran will reach an agreement to end the war. Wall Street finished the session in the red. US Treasury yields are rising, underpinning the Greenback, which, according to the US Dollar Index (DXY), which measures the buck’s value against a basket of six currencies, edges up 0.37% to 100.00.
Expectations that the energy shock caused by the Middle East war, which triggered the quasi-closure of the Strait of Hormuz, sent energy prices higher. Year to date, WTI is up 64% and Gasoline nearly 80%.
Recently, the US President Donald Trump said that he wouldn’t commit to an agreement, as speculation of an imminent attack against Iran using ground forces is at least a certainty.
The US economic docket featured Initial Jobless Claims figures for the week ending March 21. Claims rose from 205K to 210K as expected, and they were the lowest in nearly two years. The jobless claims 4-week average dipped from 210.75K to 210.5K, suggesting the labor market had stabilized.
In Australia, last week’s rate hike by the Reserve Bank of Australia (RBA) pushed the AUD/USD towards 0.7100 before reversing course amid haven flows into the US Dollar. Also, the jump in oil prices keeps the US Dollar underpinned because it is denominated in USD, which increases the correlation between WTI and the DXY.
On March 26, the RBA’s Assistant Governor Christopher Kent said that the Middle East conflict has tightened financial conditions, but that supply shock also posed a risk to inflation. He recognized that “central banks can’t change that,” but that they could cap the spike of energy prices to prevent “extended inflationary pressures.”
AUD/USD Price Forecast: Technical outlook
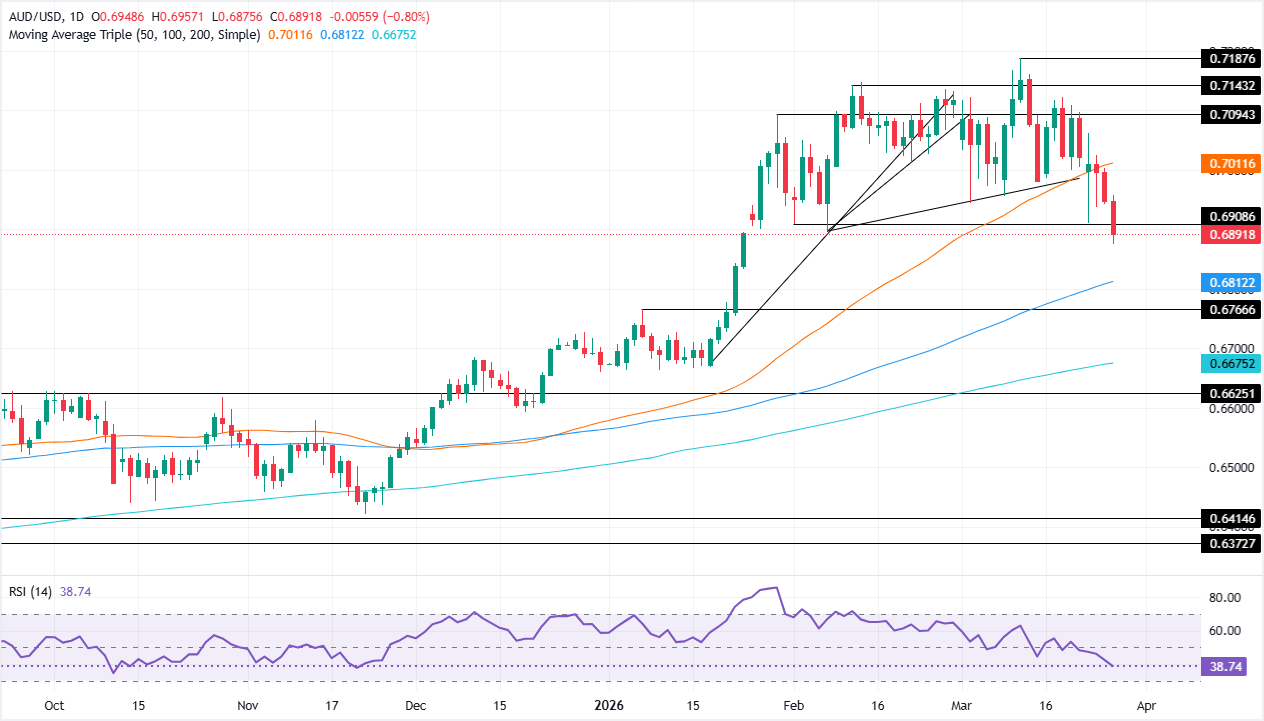
In the daily chart, AUD/USD trades at 0.6892. The near-term bias turns bearish after the pair slipped below the rising support line that had been guiding the advance from the 0.68 area and is now trading under the most recent sequence of supported closes around 0.70–0.71. Price also sits beneath the clustered simple moving averages near 0.70, which now cap the upside and confirm a loss of upward momentum. The RSI has retreated toward 40, signalling building downside pressure rather than a mere pause within the previous uptrend.
Initial resistance emerges at the 0.7000 region, where the broken ascending trend line and the grouped moving averages converge, with a break above this area needed to ease immediate selling pressure and open the way toward 0.7070. On the downside, immediate support is located at the recent low near 0.6890, with sustained weakness below exposing the 0.6800 area next. A daily close back above 0.7000 would neutralize the current bearish tone, while holding below keeps sellers in control and maintains focus on lower supports.


Comments
Log in or sign up to join the conversation.