


Bearish view
Sell the AUD/USD pair and set a take-profit at 0.7050.
Add a stop-loss at 0.7200.
Timeline: 1-2 days.
Bullish view
Buy the AUD/USD pair and set a take-profit at 0.7200.
Add a stop-loss at 0.7050.
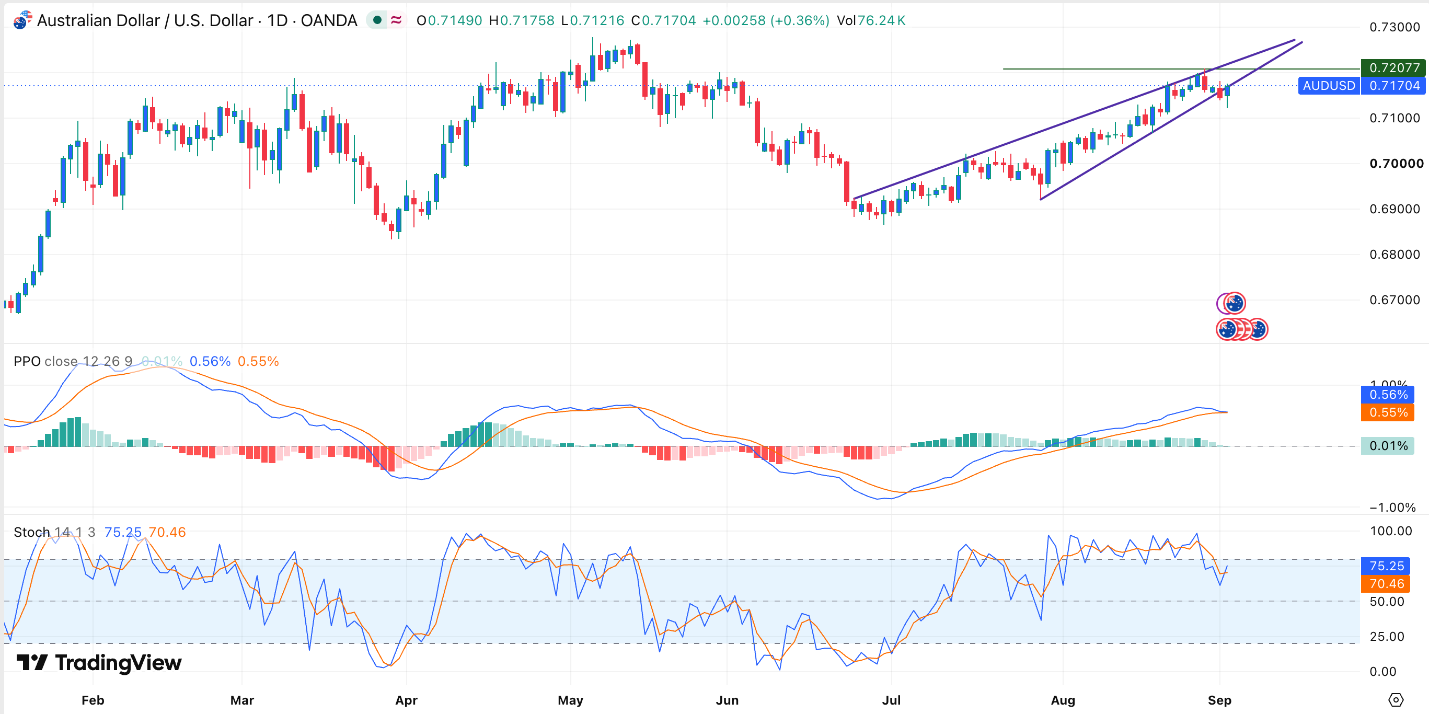
The AUD/USD pair firmed after data showed Australia's economy remained resilient despite lingering headwinds, while a stalled US dollar rebound added further support. The pair traded at 0.7170, a few pips below this week's high of 0.7207.
A report by the Austrian Bureau of Statistics (ABS) showed that the Australian economy expanded by 2.1% in the second quarter, beating the estimated 1.8%. This growth was, however, weaker than the expected 2.5%.
These numbers led many investors to start predicting that the Reserve Bank of Australia (RBA) will hike interest rates later this year. If this happens, it will be the fourth rate hike of the year, making it one of the most hawkish central banks.
The AUD/USD pair rose after ADP published a weak jobs report. According to ADP, the economy created 38k jobs in August, missing the estimated 47k. This report showed that the labor market was struggling.
Focus now shifts to the upcoming US official nonfarm payrolls (NFP) data, which will come out on Friday. Economists expect the upcoming report to show that the economy created over 84k jobs in August, a big reversal after it lost 23,000 jobs a month earlier. The unemployment rate is expected to remain unchanged at 4.2%.
These numbers will come as investors predict that the Federal Reserve will hike interest rates as soon as this month. According to the CME FedWatch Tool, odds of a hike happening this month jumped to 65%. The same is happening after last week’s Jackson Hole Symposium.
AUD/USD Technical Analysis
The daily chart shows that the AUD/USD pair has been in an upward trend and is now hovering near its highest level in August. However, there are signs that this rally is about to reverse. It formed a rising wedge pattern, a common bearish reversal pattern.
At the same time, the two lines of the Percentage Price Oscillator (PPO) have made a bearish crossover. Also, the Stochastic Oscillator has formed a bearish divergence pattern.
Therefore, there is a risk that the pair will continue falling, potentially to the key support level of 0.7050. A move above the key resistance level of 0.7200 will point to more gains.

Comments
Log in or sign up to join the conversation.