

Bearish view
Sell the AUD/USD pair and set a take-profit at 0.6900.
Add a stop-loss at 0.7100.
Timeline: 1-2 days.
Bullish view
Buy the AUD/USD pair and set a take-profit at 0.7100.
Add a stop-loss at 0.6900.
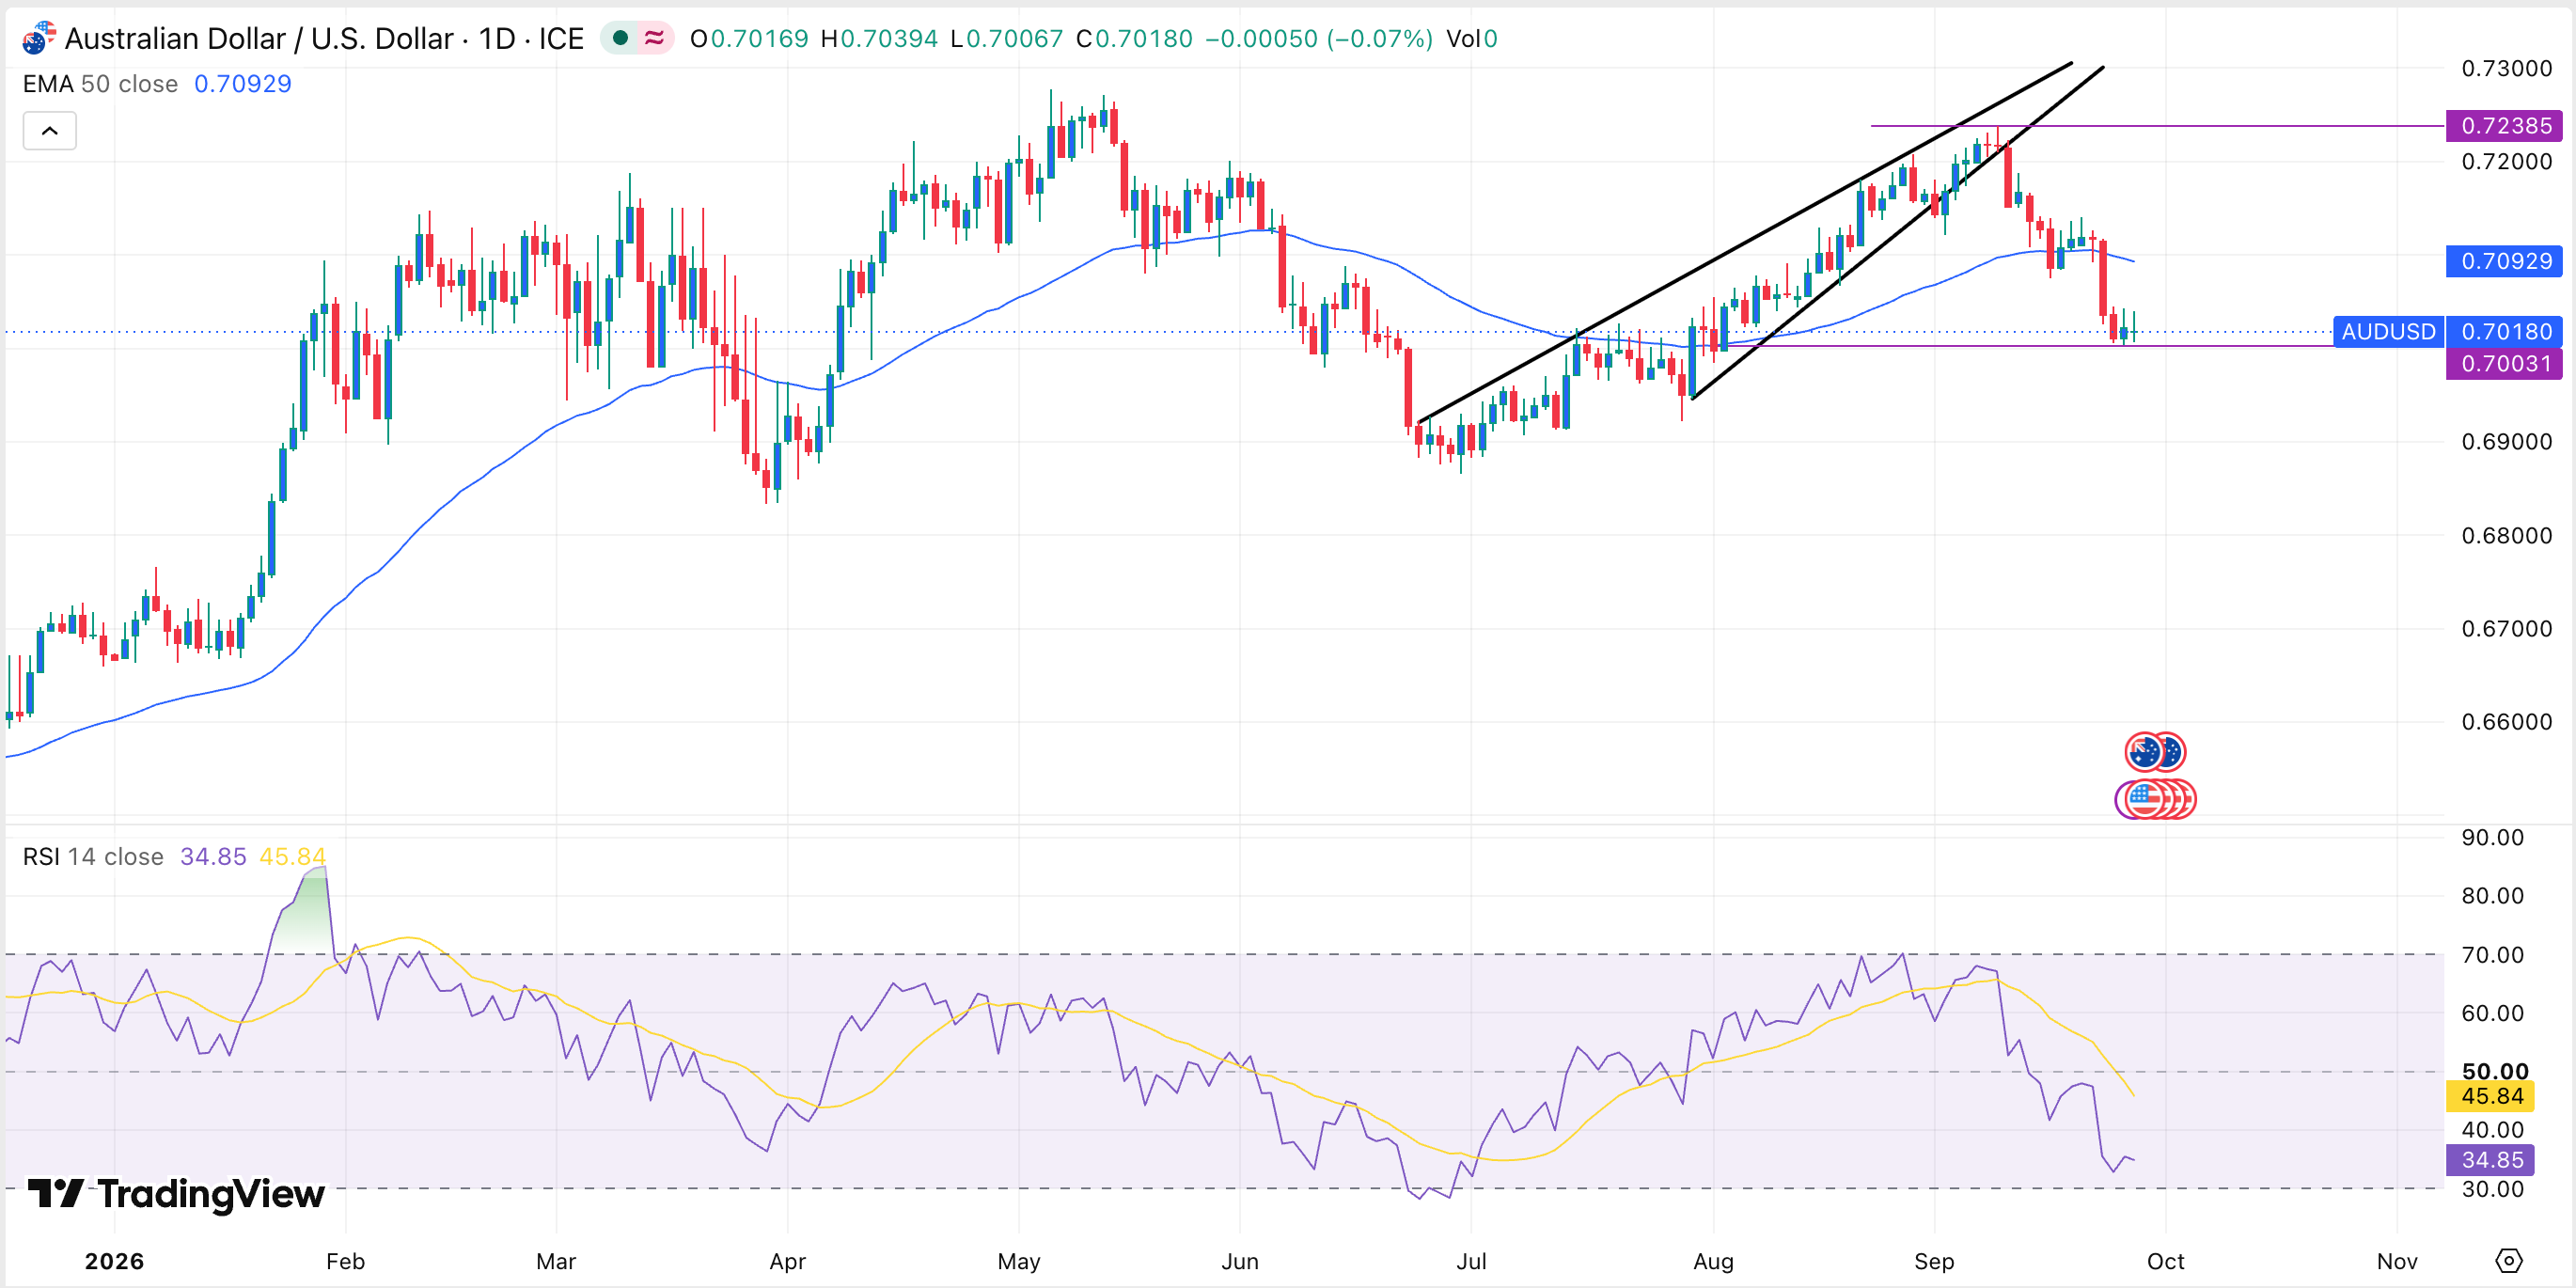
AUD/USD remained on edge on Tuesday after the Reserve Bank of Australia (RBA) delivered its closely watched interest rate decision. It was trading at 0.7017, a few points above the crucial support level of 0.700.
RBA Hikes Interest Rates
The AUD/USD pair has been in a downward trend in the past few days, and this trend continued after the Reserve Bank of Australia (RBA) delivered its interest rate decision. As was widely expected, the bank decided to hike interest rates by 0.25%, bringing the benchmark rate to 4.60%. It has hiked interest rates four times this year, making it one of the most hawkish central banks in the world.
The bank justified the rate hike to the fact that inflation has remained above its target in the past few months. This trend may continue because of the rising gasoline and diesel prices in Australia. As a result, officials hinted that they may be forced to hike interest rates again.
The next important data to watch will be the Australian consumer inflation report. Economists expect the report, which comes out on Thursday, to show that the headline and core CPI remained above 3% during the month. This inflation report will help to determine whether the RBA will deliver another hike this year.
The AUD/USD pair will also react to the upcoming macro numbers from the United States. The Bureau of Labor Statistics (BLS) will publish the latest JOLTS job openings report, which will shed light on the labor market.
Further, the Conference Board will release the latest consumer confidence report, while the Federal Housing Finance Agency will publish the house price index data. The most important data to watch will be the US nonfarm payrolls report, which will provide hints on the labor market.
AUD/USD Technical Analysis
The daily chart shows that the AUD/USD pair has slumped in the past few weeks. It has already moved below the 50-day and 100-day Exponential Moving Average, a sign that bears are in control for now. This retreat happened after the pair formed a rising wedge pattern.
The pair has formed a bearish flag pattern, a common continuation sign in technical analysis. Also, the Relative Strength Index (RSI) has dropped and is nearing the oversold level. Therefore, it may continue falling in the near term. If this happens, the next key level to watch will be at 0.6900.


Comments
Log in or sign up to join the conversation.