


Bearish view
Sell the AUD/USD pair and set a take-profit at 0.6900.
Add a stop-loss at 0.7050.
Timeline: 1-2 days.
Bullish view
Buy the AUD/USD pair and set a take-profit at 0.7050.
Add a stop-loss at 0.6900.
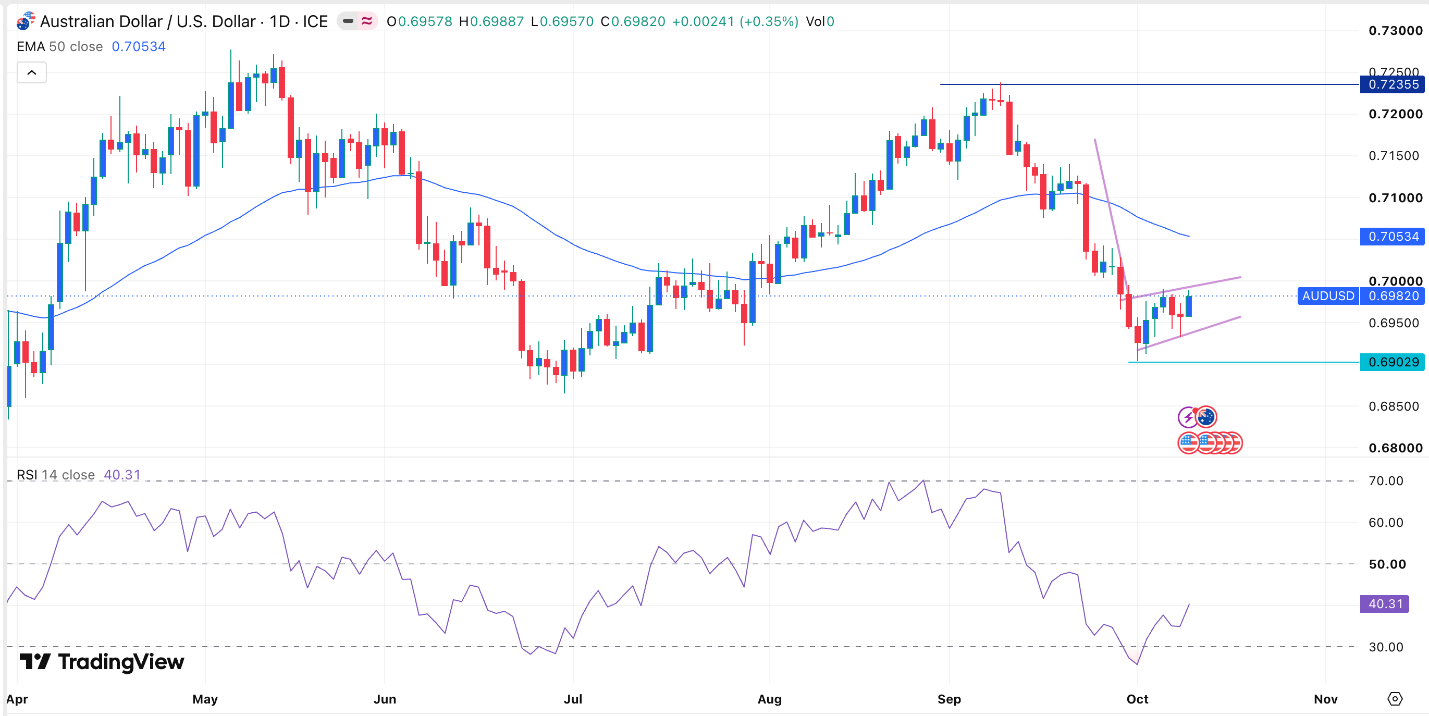
The AUD/USD exchange rate has wavered in the past few days as investors have watched the performance of the US and Australian bond markets. It also reacted to the upcoming US consumer inflation data and RBA minutes. It was trading at 0.6982 on Monday, down modestly from last month’s high of 0.7235.
RBA Minutes and US Inflation Data
The AUD/USD pair will have some notable events in the coming days. The first one will be the upcoming minutes of the last Reserve Bank of Australia (RBA) meeting. These minutes will provide more details about what to expect in the upcoming meetings.
Michelle Bullock and her team decided to hike interest rates by 0.25% in the last meeting. It was the fourth interest rate hike of the year, with officials expecting the bank to deliver at least one hike citing the elevated inflation. Australian officials have also pointed to the rising bond yields, with the ten-year yield rising to 5.44%, its highest level in years.
The AUD/USD pair will next react to the upcoming statements from top Federal Reserve officials. Some of the most notable ones are Christopher Waller, Susan Collins, and Tom Barkin. These officials will provide hints on what to expect from the Fed this year.
The most important data to watch will be the US consumer inflation report on Wednesday. Economists expect the data to show that the headline CPI rose to 3.6% last month. Core inflation is also expected to remain at an elevated level as well.
The US inflation numbers will come two weeks after the US published a weak jobs report, which showed that the economy created over 29k jobs in September. The unemployment rate rose to 4.2%, pushing investors to scale back their interest rates expectations.
AUD/USD Technical Analysis
The daily chart shows that the AUD/USD pair bottomed at 0.6902 and then rebounded to the current 0.6982. It has dropped below the 50-day Exponential Moving Average (EMA).
At the same time, the pair has formed a bearish flag pattern, which is made up of a vertical line and an ascending channel. This pattern often leads to a bearish breakout.
Therefore, the pair will likely resume the downward trend, potentially to this month’s low of 0.6900. A move below that level will point to more downside.


Comments
Log in or sign up to join the conversation.