

(Click on image to enlarge)
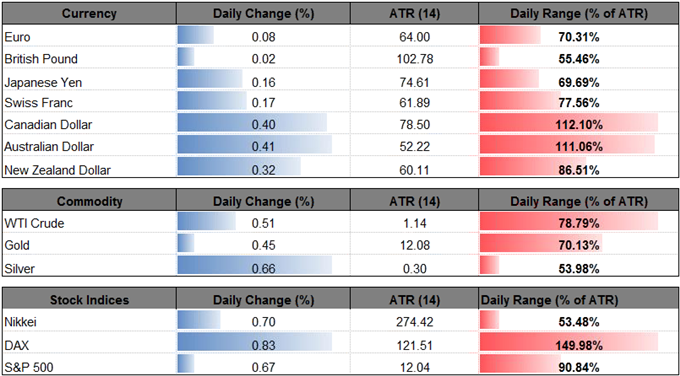

The Australian dollar outperforms its major counterparts, with AUD/USD at risk for a larger rebound as the Reserve Bank of Australia (RBA) gradually alters the outlook for monetary policy.
A bullish engulfing appears to be taking shape in the aussie-dollar exchange rate as Governor Philip Lowewarns ‘that ‘it is more likely that the next move in interest rates will be up, rather than down,’ but it seems as though the central bank will carry the record-low cash rate into 2018 as officials are ‘prepared to be patient.’ With that said, the RBA may continue to tame expectations for an imminent rate-hike as ‘the subdued outlook for inflation mean that there is not a strong case for a near-term adjustment in monetary policy.’
In turn, the RBA’s wait-and-see approach may keep the broader outlook for AUD/USD tilted to the downside, but the near-term weakness in the exchange rate appears to be abating especially as the Relative Strength Index (RSI) continues to hold above oversold territory.
AUD/USD Daily Chart
(Click on image to enlarge)
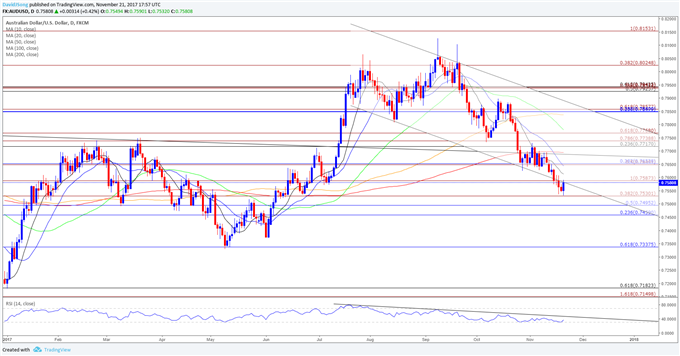
- Failure to break below the 0.7460 (23.6% retracement) to 0.7530 (38.2% expansion) region may spur a larger rebound in AUD/USD as it carves a bullish outside-day (engulfing), with a break/close above 0.7590 (100% expansion) raising the risk for a move back towards 0.7650 (38.2% retracement).
- May see AUD/USD continue to broadly track the downward trending channel carried over from September as the Relative Strength Index (RSI) highlights a similar behavior, but a divergence appears to be taking shape as the oscillator turns around ahead of oversold territory; may see aussie-dollar stage a more meaningful correction if the RSI snaps the bearish formation.
- Next topside hurdle comes in around the former-support zone around 0.7720 (23.6% retracement) to 0.7770 (61.8% expansion), which lines up with the November-high (0.7730).

USD/JPY struggles to preserve the rebound from earlier this week even as U.S. Existing Home Sales climbs another 2.0% in October, and the pair may continue to give back the advance from the September-low (107.32) as both price and the Relative Strength Index (RSI) cling to the bearish trends from earlier this month.
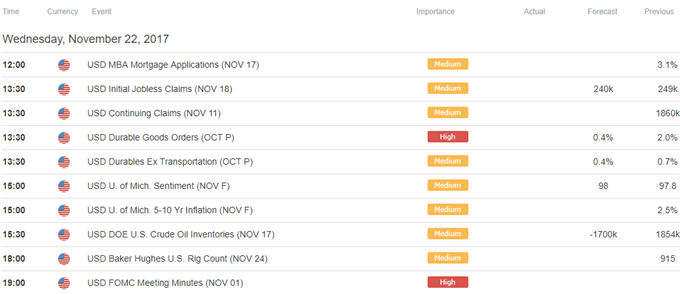
With all eyes on the Federal Open Market Committee (FOMC) Minutes, the fresh batch of central bank rhetoric may boost the appeal of the greenback as Chair Janet Yellen and Co. appear to be on course to raise the benchmark interest rate in December. The FOMC may also highlight higher borrowing-costs for 2018 as inflation is expected ‘to stabilize around the Committee's 2 percent objective over the medium term,’ but more of the same from Fed officials may keep USD/JPY under pressure as it raises the risk of seeing a dovish rate-hike.
The FOMC may adopt a more dovish tone ahead of the upcoming rotation in 2018 as ‘many participants expressed concern that the low inflation readings this year might reflect not only transitory factors, but also the influence of developments that could prove more persistent,’ and the dollar-yen exchange rate may continue to exhibit a bearish behavior ahead of the major U.S. holiday as the Fed runs the runs the risk of completing its normalization-cycle ahead of schedule.
USD/JPY Daily Chart
(Click on image to enlarge)
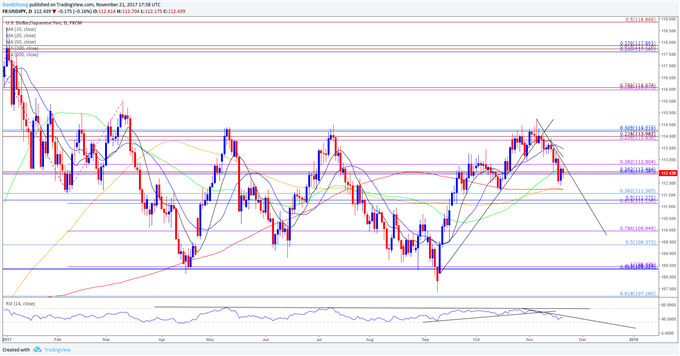
- Downside targets may come back on the radar for USD/JPY as it struggles to close back above the 112.30 (61.8% retracement) to 112.80 (38.2% expansion) region, but the near-term outlook remains mired by the bearish tilt in price & the Relative Strength Index (RSI).
- A move below the 200-Day SMA (111.74) opens up the 111.10 (61.8% expansion) to 111.30 (50% retracement) region, with the next downside hurdle coming in around 109.40 (50% retracement) to 110.00 (78.6% expansion) followed by the Fibonacci overlap around 108.30 (61.8% retracement) to 108.40 (100% expansion).
(Click on image to enlarge)



Comments
Log in or sign up to join the conversation.