
Early this month, by using our usual strategy we made the perfect call of determining the turnaround of wave (X) and we called it very precisely.
As mentioned above, Aussie was travelling through wave (X) to the upside prior to unfolding to the downside which would be playing into wave (Y). Inside wave (X), we were also forming a double correction and were in the 7th swing, this is the pinnacle point where we would establish the region, we should expect wave (X) to reach its maturity.
(Click on image to enlarge)
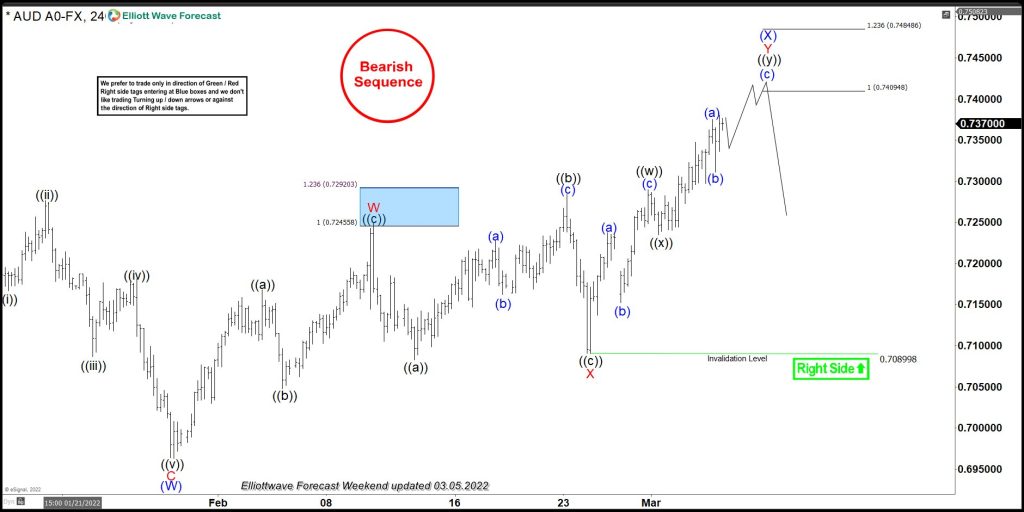
We created a regional area by using the Fibonacci Extension tool and drew it between 3 points, origin point to the extreme point of wave W and then to the extreme of wave X on a lower degree. This concluded that the region we were playing a turnaround was within 0.740 – 0.748.
AUDUSD H4 chart from 10th March 2022
(Click on image to enlarge)

As per shown from our chart two days after, we can see that we formed wave ((i)) which determined that AUDUSD did turnaround within the region we drew. Ever since then the market is still playing within wave (Y) to the downside if price remains to be held beneath 0.744.
The moral of the turnaround is that rather than choosing one specific price to expect the market to unfold, the market is not perfect. It is best to create a regional zone confluence with an invalidation level.

Comments
Log in or sign up to join the conversation.