

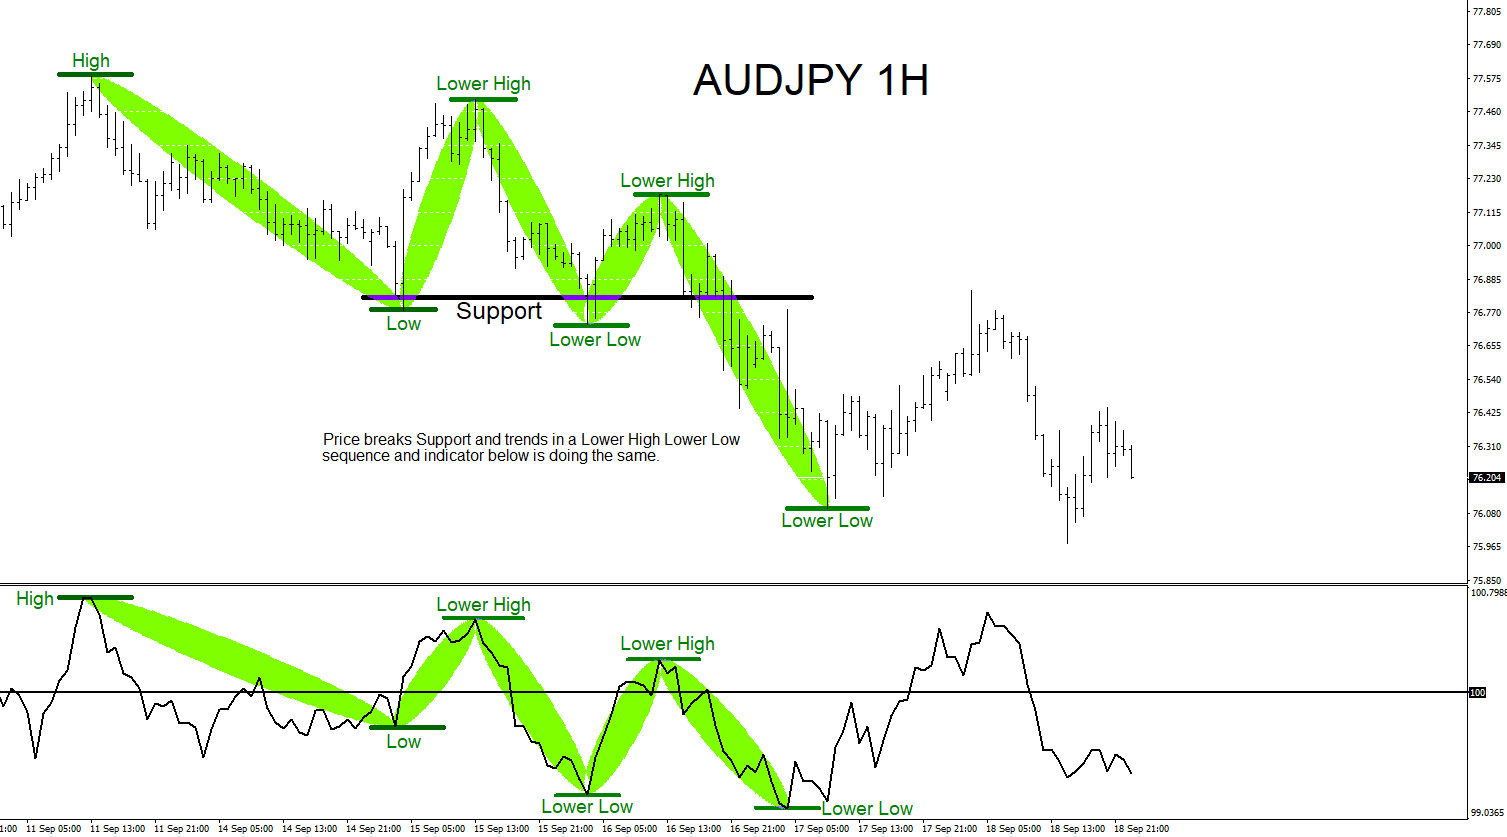
On September 10, AUDJPY registered a temporary top and started to trend lower. When a market is trending, it will make higher highs with higher lows in a bullish trend, and lower lows with lower highs in a bearish trend.
The chart below confirms AUDJPY was trending lower and making lower lows with lower highs. Sellers entered the market when the price broke below the support level (black), which pushed the pair lower.
AUDJPY One-Hour Chart September 18, 2020
After sellers pushed the price lower, AUDJPY found a temporary lower low. Then, the pair started to make a correction pullback higher. The chart below shows the market was signalling sellers to watch for more selling opportunities.
The bearish divergence pattern (pink) was already showing a higher high on the oscillator, while the price chart was not, thus signalling traders to watch a retest of the support level to become a possible resistance level.
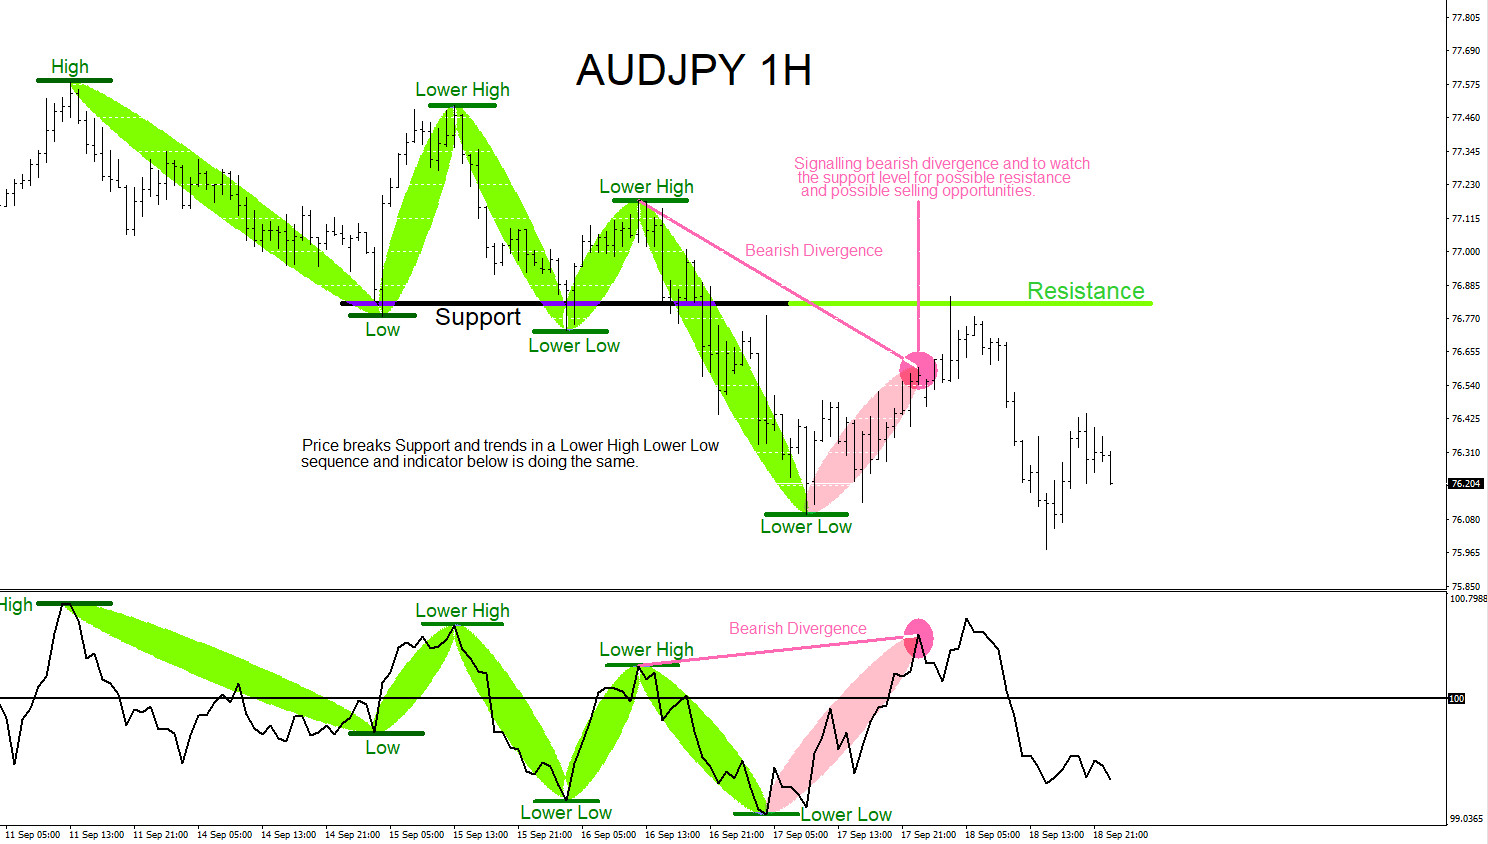
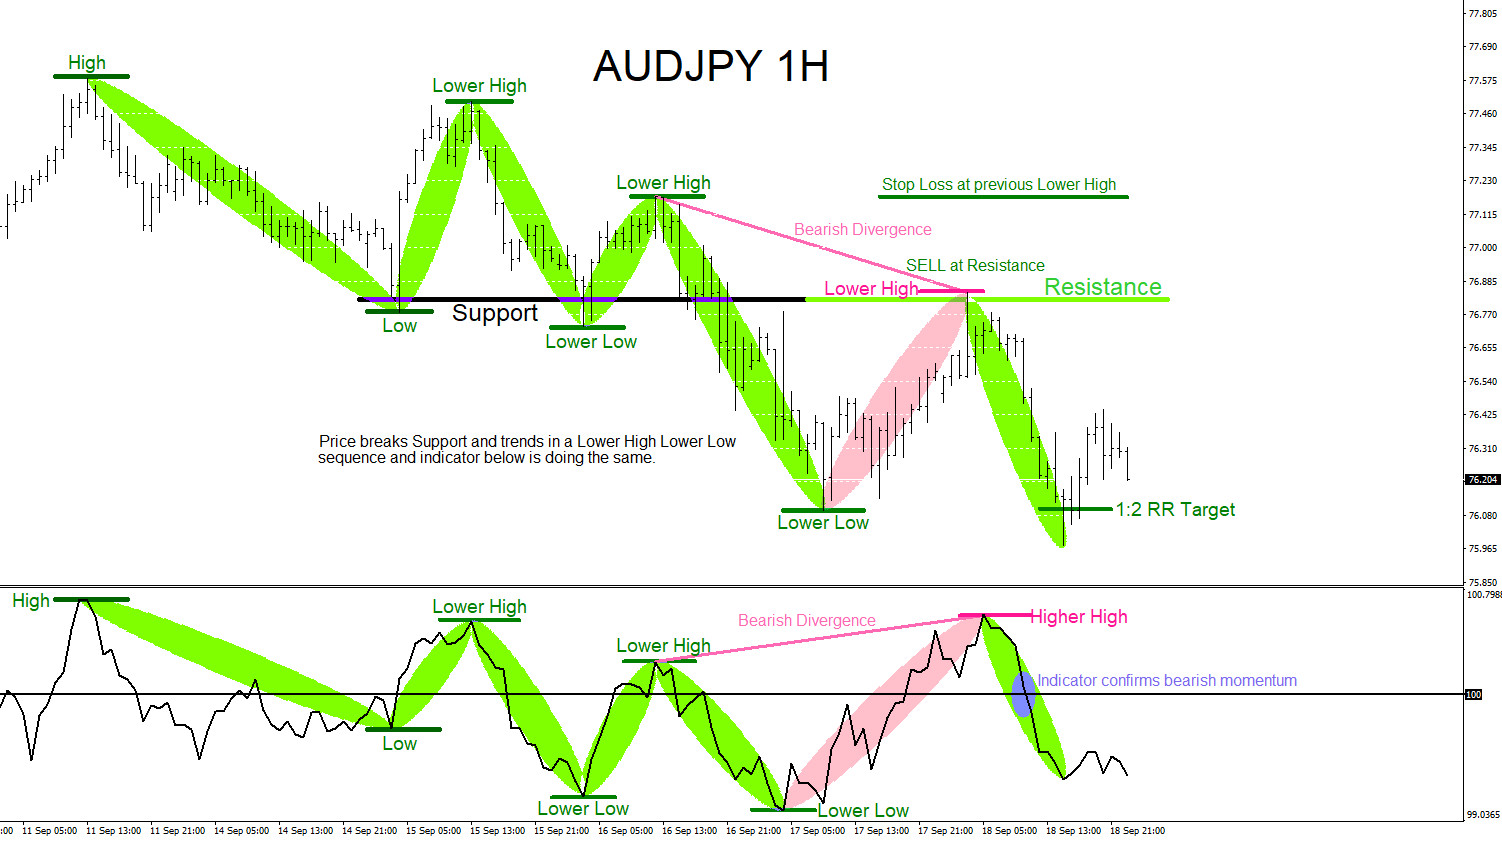
The price retested and hit the previous support level where sellers push AUDJPY lower. Support became resistance and the bearish trend continuation divergence pattern (pink) terminated. With the price making lower highs and the oscillator making higher highs, more sellers entered the market looking for another round lower.
The oscillator confirms bearish momentum, and the pair eventually hit the 1:2 RR Target. When trading a trend sequence, hard stops should be placed above the previous lower high when selling, and the higher low when buying.
Of course, like any strategy or technique, there will be times when the strategy or technique fails, so proper money/risk management should always be used on every trade.
Comments
Log in or sign up to join the conversation.