

Monetary conditions, which includes Fed policy, remain exceptionally/historically favorable. Both economic data and corporate earnings have been coming in better than expected. Inflation, while showing some signs of life recently, isn't likely to be a problem for stocks in the foreseeable future. And while valuations are clearly high, this is a fairly common occurrence in post-recession market cycles (see explanation below). Thus, my take is the fundamentals continue to support the bull case.
My Take on the State of the Fundamental Backdrop...
There are no changes to report on the Fundamental Factors board this week. As I've been saying, I believe the uber-friendly monetary conditions basically trump everything else on the board here.
On the inflation front, while this week's releases definitely got the bond market's attention (the yield on the U.S. 10-Year moved from 0.54% to 0.72% this week), the stock market remains sanguine on the subject due to the idea that the Fed is likely to let the economy "run hot" for quite some time in order to bring unemployment down to desired levels. In sum, my take is the board is more positive than the block colors might indicate at first glance.
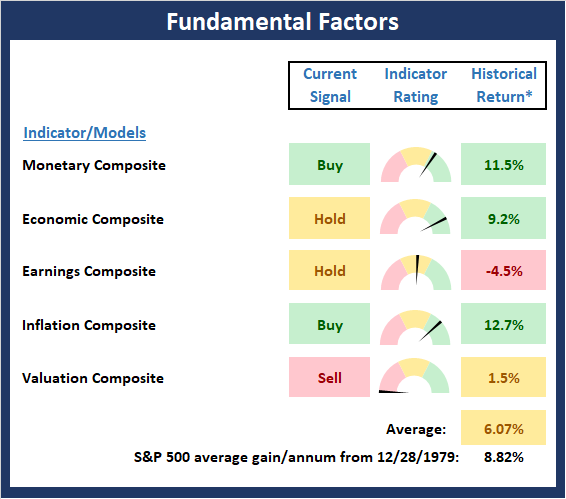
* Source: Ned Davis Research (NDR) as of the date of publication. Historical returns are hypothetical average annual performances calculated by NDR. Past performances do not guarantee future results or profitability - NOT INDIVIDUAL INVESTMENT ADVICE.
The clear negative on the board is the valuation section. With the guage reading pegged at 0%, there can be little argument that the reading is worrisome. Below are three charts that support the negative readings seen on the valuation composite.
First up is the Median Price-to-Earnings Ratio for the S&P 500.
Median P/E Ratio - S&P 500
(Click on image to enlarge)

Image Source: Ned Davis Research Group
For those not familiar with the concept, the Median P/E Ratio looks at the P/E ratio of the median stock within the index - i.e. half above and half below. As such, this provides a nice cross-section reading of the index.
As you can see on the chart, the current reading is clearly elevated and is only eclipsed by the readings seen in 1999 and again in 2002.
Next up is a chart of the same median P/E concept applied to a much broader, multi-cap universe of the approximately 1500 stocks large enough for institutional investors to own.
Median P/E Ratio - Multicap Universe
(Click on image to enlarge)

Image Source: Ned Davis Research Group
The takeaway here is that the broad market valuation looks to be even hotter than the S&P's with the only higher reading seen during the tech bubble of late 1999/2000.
Finally, let's look at the traditional P/E ratio of an even broader index - the Value Line Composite.
P/E Ratio - Value Line
(Click on image to enlarge)

Image Source: Ned Davis Research Group
If the word "Yikes!" comes to mind when looking at this chart, join the club. The bottom line is that the current spike has pushed the P/E to the highest levels - ever.
But... (You knew that was coming, right?) It is important to understand that P/E's tend to spike after the economy experiences a recession. The key here is to remember that the stock market is a discounting mechanism of future expectations. So, as the economy enters a recession, stock prices (the "P" in P/E) tend to decline precipitously. Naturally, this pushes the P/E Ratio down. The best example of this would be the 2008 financial crisis.
However, as the recession runs its course, Ms. Market begins to sniff out the turn in the economy. Just as we are seeing now, investors "look ahead" to better days by buying stocks BEFORE the economic data - and more importantly, earnings - actually improve. So, with prices moving higher on expectations of an improving economy and earnings having taken a hit from the recession, the P/E ratio tends to spike higher.
From my seat, this is EXACTLY what we are seeing now. The "P" is moving up on hopes for better economic growth while the "E" remains has yet to improve. The result is an abnormally high P/E ratio.
So... As long as the "better days" that investors are looking ahead to show up within the window of time the stock market expects, a spike in P/E's after a recession isn't something to worry about. However, if the anticipated recoveries in the economy and earnings are either delayed or worse, derailed, then the elevated P/E's can present a problem.
On the other side of the valuation coin is the case where P/E's become elevated during an economic expansion. I'll argue this represents a case of "multiple expansion" which in some cases is warranted (i.e. when economic growth is strong) and others, well, not so much (think the technology bubble).
Of course, some analysts argue that we are seeing the equivalent of a bubble in the megacap leaders commonly referred to as FANMAG (FB, AMZN, NFLX, MSFT, AAPL, and GOOGL). Given that this is a complicated issue, I'll save this discussion for another day.



Comments
Log in or sign up to join the conversation.