

Executive Summary:
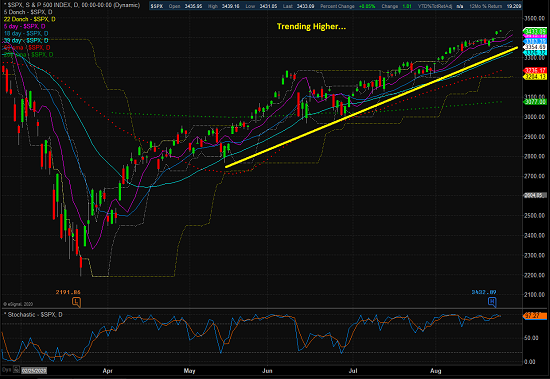
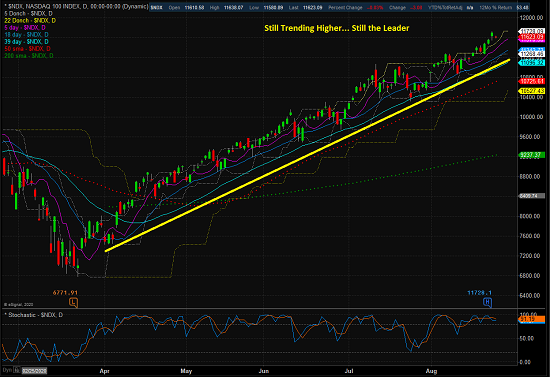
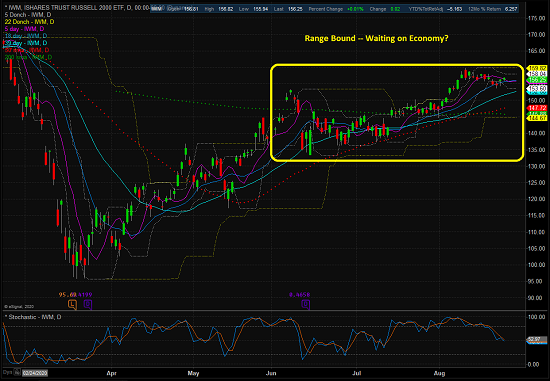
The question from our last technical review was if the stock market was "breaking out" to the upside. Cutting to the chase, the answer depends on what "market" you are looking at. To be sure, both the S&P 500 and NASDAQ 100 have broken out their recent consolidation ranges and are now trending higher. However, small-caps, mid-caps, and any index relating to value are clearly stuck in a range - likely waiting on signs that the economic recovery will actually show up.
The State of the Trend Indicators
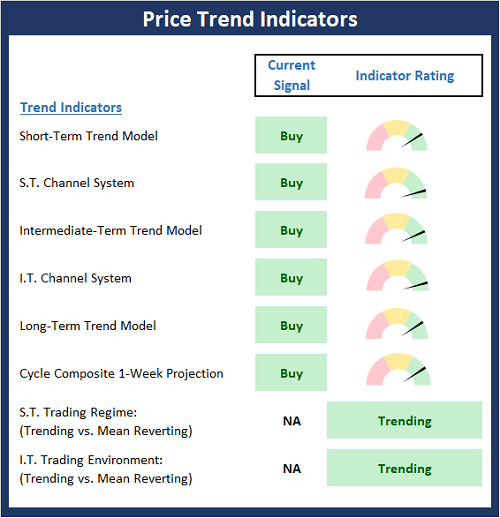
About The Trend Board Indicators: The models/indicators on the Trend Board are designed to determine the overall technical health of the current stock market trend in terms of the short- and intermediate-term time frames.
The Trend board scores a perfect 10.0 again this week as all the models/indicators are both on buy signals and rated positively. From a weight-of-the-evidence standpoint, there isn't much to complain about here.
NOT INDIVIDUAL INVESTMENT ADVICE.
View Trend Indicator Board Online
The only nagging concern is that outside of the AAPL, AMZN, and the rest of the COVID Winners, there doesn't appear to much enthusiasm behind the move. Analysts of all shapes and sizes these days are saying the market is experiencing "narrow leadership," which is a condition that usually ends badly.
However, my view is that given the COVID world we now live in, the universe of companies that can "grow" is much smaller than normal. And at the same time, the pool of capital looking to invest in "market leadership" is larger than ever. As such, the concentration in the COVID Winners, while extraordinary, looks to be relatively normal for this "new normal" world.
So, until the economy can find "normal" again, this is likely the way the game will continue to be played.
My Take on the State of the Charts...
The most bullish thing a stock or index can do is make new all-time highs. So, as far as the S&P 500 and NASDAQ/NASDAQ 100 indices are concerned, the bulls remain large and in charge as the trend is clearly an investor's best friend here.
S&P 500 - Daily
NASDAQ 100 - Daily
However, the song does not remain the same when one gets away from mega-cap growth names. As I mentioned above, the small-caps, mid-caps, and value names remain range-bound. And while these indices do perform well on days when traders focus on economic improvement, the trend remains largely sideways.
iShares Russell 2000 ETF (IWM) - Daily
Next, let's check in on the state of the market's internal momentum indicators.

View Momentum Indicator Board Online
* Source: Ned Davis Research (NDR) as of the date of publication. Historical returns are hypothetical average annual performances calculated by NDR. Past performances do not guarantee future results or profitability - NOT INDIVIDUAL INVESTMENT ADVICE.
Given the perfect 10.0 seen on the Trend Board, one might expect to see the Momentum Board sporting more green than it currently does. In short, if we were seeing a broad-based market advance, the board would likely be universally green. However, since there are divergences between the megacap COVID Winners and the broader market, I'm not surprised to see some cracks in the foundation from a momentum standpoint.



Comments
Log in or sign up to join the conversation.