
Biggest Jump In Wages In Seventeen Months
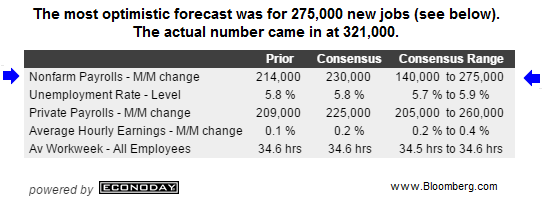
Nothing is ever cut-and-dried on Wall Street. While Friday’s employment figure easily exceeded expectations, the wage figures increase the odds of the Fed stepping in sooner rather than later. From Bloomberg:
The 321,000 advance in payrolls exceeded the most optimistic projection in a Bloomberg survey of economists and followed a 243,000 gain in October that was stronger than previously reported, figures from the Labor Department showed today in Washington. The jobless rate held at a six-year low of 5.8 percent. Average hourly earnings rose 0.4 percent, the most since June of last year.
Negative Slope Says Higher Risk
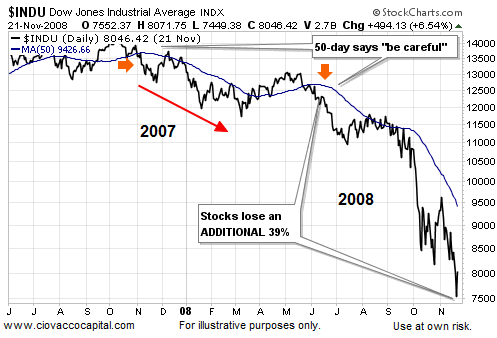
With the “growth vs. Fed tug-of-war” going on, we can use trends to get a better handle on the market’s net aggregate stance. Trends help us filter out the day-to-day noise in the equity markets. Moving averages are one of many ways to monitor market trends. Professional traders and managers often use the 50-day moving average to monitor intermediate-term trends in stock prices. In the chart below, the Dow’s 50-day moving average rolled over two times, once in late 2007 and again in mid-2008, warning investors of increasing downside risks (see orange arrows). Note stocks lost an additional 39% after the 50-day rolled over in June 2008, meaning observable warnings came before the big plunge.
How Does The Dow Look Now?
With investors trying to balance an improving economy with the increasing odds of a Fed rate hike, stocks had an indecisive look between mid-summer and early fall 2014 (see orange arrow). The conviction of market participants has improved since the October low. Notice how the slope of the Dow’s 50-day has turned up in a bullish manner (green arrow).
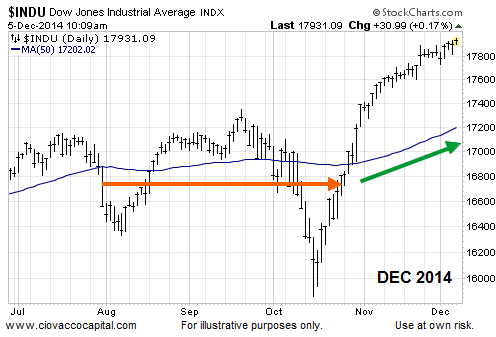
The chart above does not predict the future, but it can help us assess the probability of good things happening relative to the probability of bad things happening. The current profile continues to favor “good things happening” for stocks.
Investment Implications - The Weight of The Evidence
As of Thursday’s close, our market model was still calling for an equity-heavy allocation (SPY). Could fear of a Fed rate hike turn the tide for risk assets? Sure it could, but rather than anticipating when a turn may come, our approach requires observable evidence of a bearish shift, something we have not seen yet.
Market Forecasts Similar To A Coin Flip
As college football heads into championship weekend, this timely video clip compares handicapping the outcome of a football game to attempting to forecast where the stock market is headed. After you see the comparison, it is not difficult to understand why “paying attention to facts and making adjustments” has numerous advantages over attempting to invest based on market forecasts.


Comments
Log in or sign up to join the conversation.