
Good Monday – oops, I mean Tuesday morning, and welcome back to the game. As usual let’s start the week with a review of the state of the market and our major market indicators/models.
The first step is a review of the price/trend of the market. Here’s my current take on the state of the technical picture…
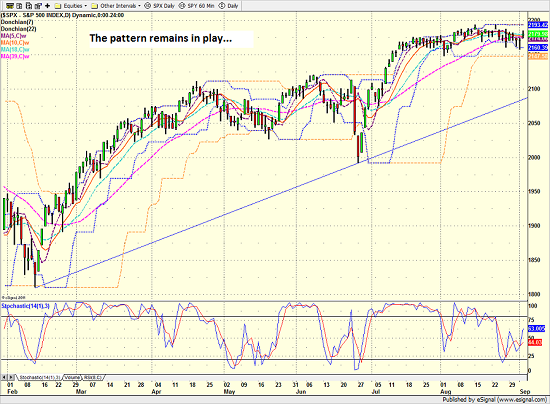
- Please use your best Mr. Rogers voice here… Can you say, sideways? Sure, I knew you could.
- The recent pattern which sees stocks rally then consolidate for an extended period of time remains intact
- Save the BREXIT freakout, sideways has been the new down for nearly 7 months now
- This is especially encouraging given the seasonality in play at this time of year
- Short-term line in the sand is last week’s intraday low of 2157
- Key closing line in the sand is at exact same spot
- And a downside break of 2147 would be especially problematic
- But if bears don’t get something going in next week or so, bulls likely to resume march higher
S&P 500 – Daily
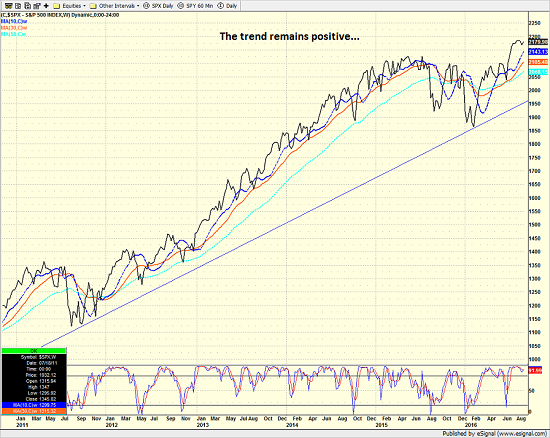
From a longer-term perspective (e.g. looking at a weekly chart of the S&P 500)…
- The song remains the same – the weekly trend is positive
- No change in the key support zone at 2126
- Resistance on weekly chart is not meaningful at this time
- A weekly close below 2037 would mean bears are back in charge of the game
- Weekly close below 1950 would suggest more downside ahead
- Weekly close below 1864 would mean the cyclical bull would be at risk
- But for now, this appears to be a “pause that refreshes”
S&P 500 – Weekly
Next, let’s look at the “state of the trend” from our indicator panel. These indicators are designed to give us a feel for the overall health of the current short- and intermediate-term trend models.
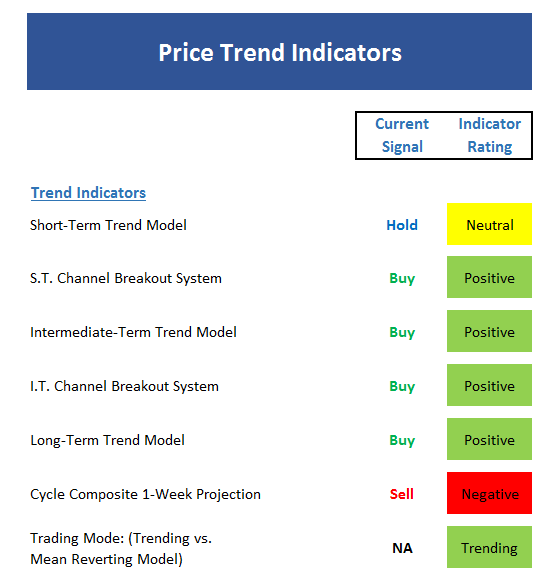
- Nothing really new or surprising on the board this week
- Short-term trend is neutral (duh)
- Biggest item of note here is the cycle composite going red
- Cycle composite will stay red for a while here
- The “strength of the trend” indicators have weakened – but market still in a “trending” mode for now
- I’m paying more attention to the Donchian channels over moving averages here
Now we turn to the momentum indicators…
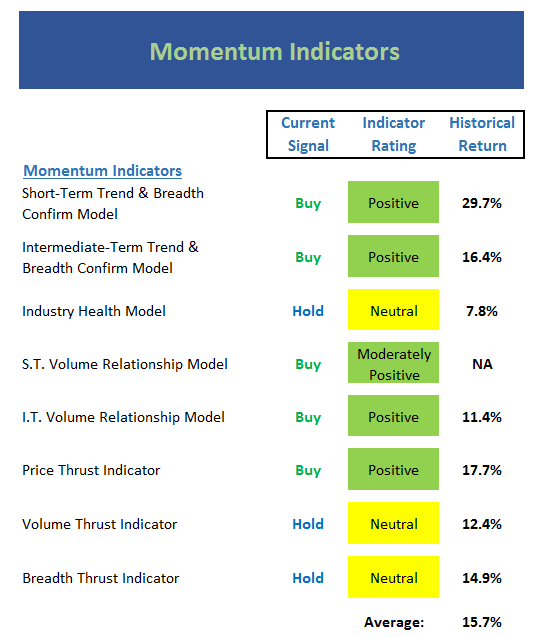
- Executive Summary: Intermediate-term momentum is positive, but short-term momentum has waned
- Industry Health model remains my biggest concern. I’d like to see broader participation in the rally
- Yellow boxes for Volume and Breadth Thrust indicators are normal right about now and not a reason for alarm
- This board suggests that we should continue to give the bulls the benefit of the doubt
Next up is the “early warning” board, which is designed to indicate when traders may start to “go the other way” for a trade.
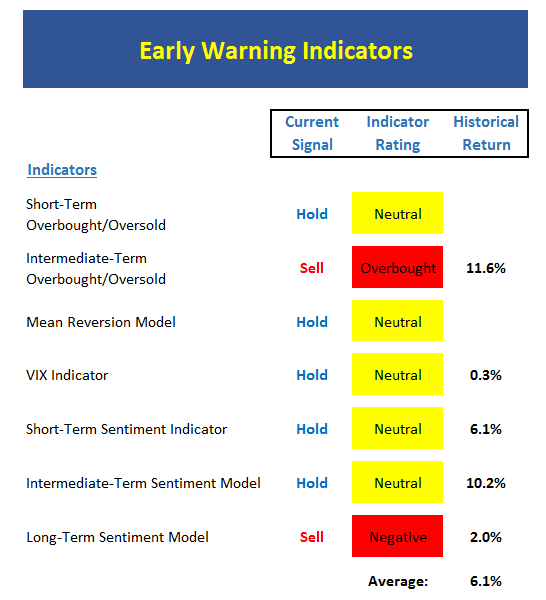
- However… the Early Warning board suggests a mean reverting move could begin at any time
- If stocks become overbought in near-term, the stars could easily align for a decent pullback
- VIX remains VERY low (suggests sentiment is too optimistic)
- Sentiment models have not hit extreme levels yet (i.e. sentiment is not a reason to head for hills)
- Mean Reversion model basically “stuck” in neutral
Now let’s move on to the market’s “external factors” – the indicators designed to tell us the state of the big-picture market drivers including monetary conditions, the economy, inflation, and valuations.
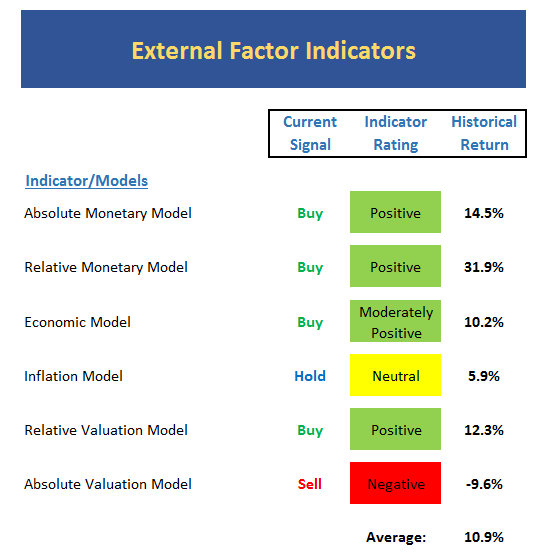
- While the box color didn’t change, both Monetary Models perked up last week
- A component model in the Economic Model has moved further into the “strong growth” mode – this suggests the economy should pick up in Q3 and again in Q4
- GDP has improved in second half of year for several years running
- The trend of the inflation model is clear – expect inflation expectations to continue to move higher
- Valuation argument continues unabated
- Absolute valuation metrics continue to get worse
- But with rates still at generational lows, there is no competition for stocks
Finally, let’s review our favorite big-picture market models, which are designed to tell us which team is in control of the prevailing major trend.
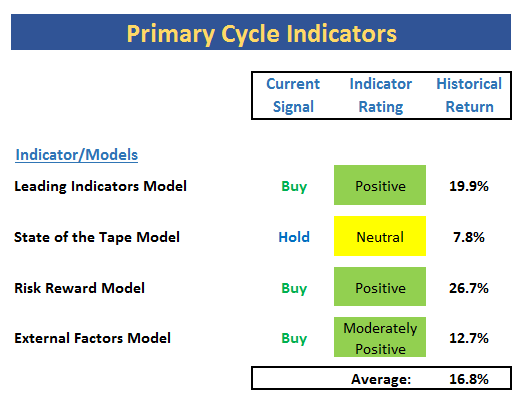
- Board suggests bulls still solidly in charge
- The “State of the Tape” model remains a nagging indicator
- However, the Risk/Reward model still strong
- The External Factors model weakened a bit last week
- All in, no reason for concern here…
The Takeaway…
Although stocks remain overbought and both sentiment and seasonality are not positive at the present time, the bottom line is the bears have been unable to get anything going (so far). And while I can easily argue that short-term traders may want to become/remain cautious here, longer-term investors ought to be ready, willing, and able to buy any dip that presents itself in the next month and a half. Remember, the low seen in October is historically the low for the ensuing quarters. So, if you find yourself underinvested or looking for a way to put cash to work, well, you know what to do…


Comments
Log in or sign up to join the conversation.