

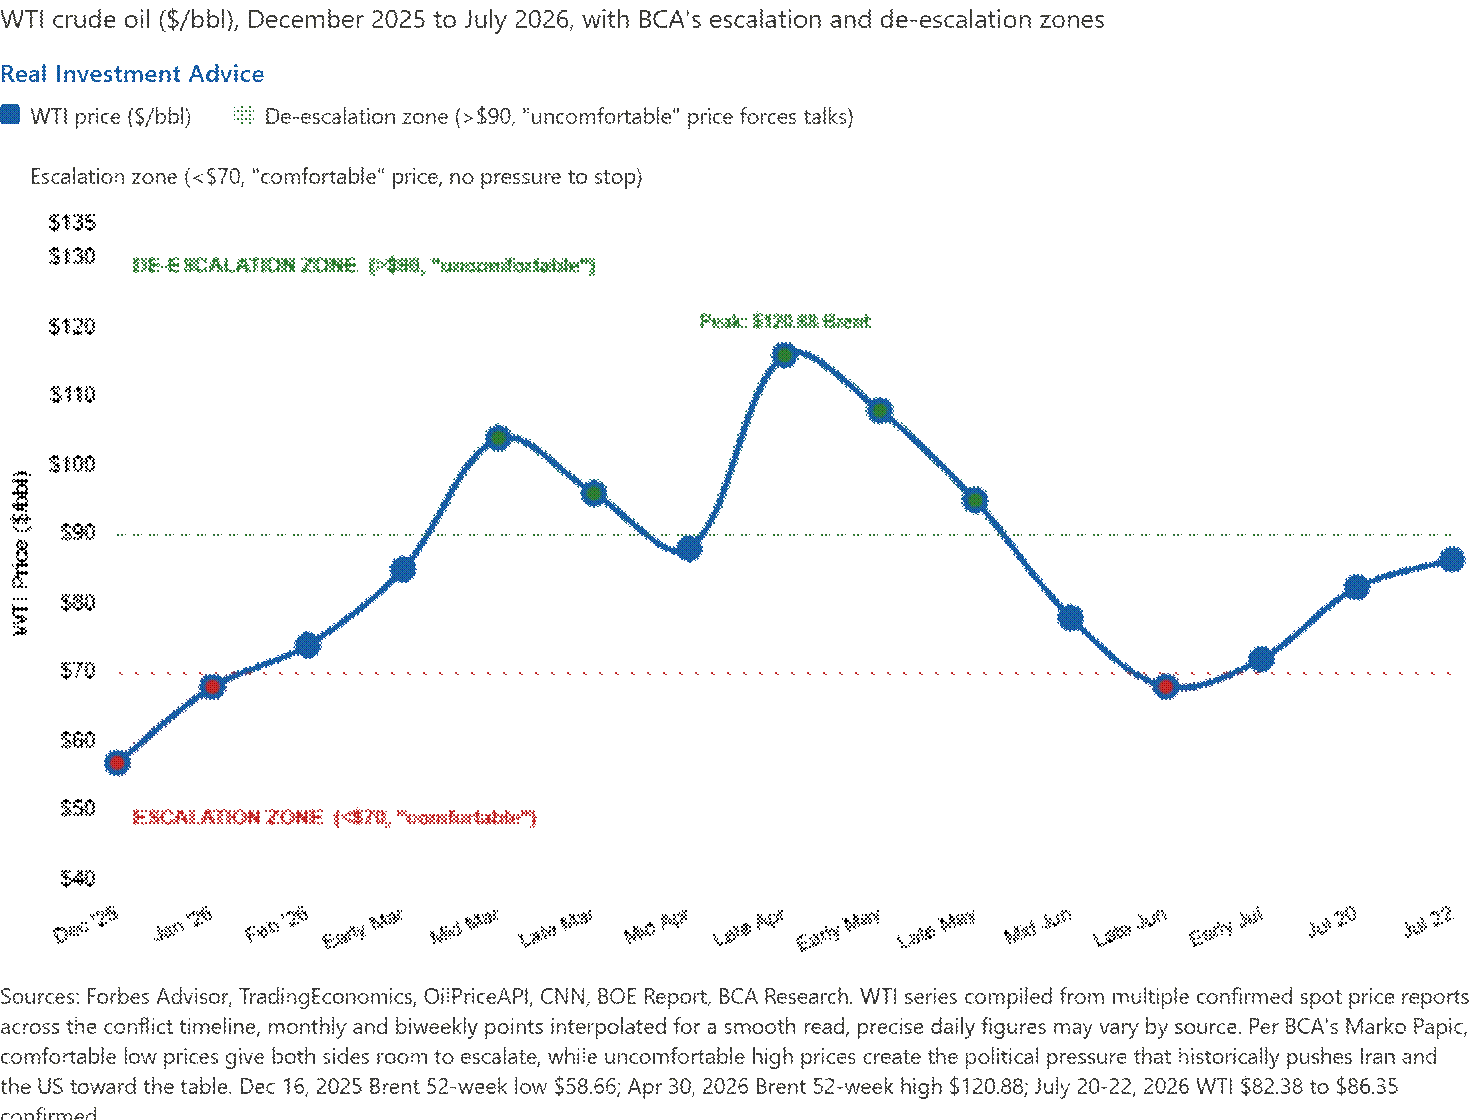
In physics, kinetic equilibrium describes a system in which forces are balanced, and motion continues at a steady, unchanging rate. Felix Vezina-Poirier of BCA Research argues that we can apply kinetic equilibrium to the Iran conflict. Unlike most analysts, he believes that oil prices are not the result of the ebbs and flows in the conflict. Instead, he thinks oil prices are steering the conflict. When oil prices are at the lower end of the recent range, both sides appear more comfortable bad-mouthing each other and escalating their actions. Conversely, when oil prices climb, the political pressure forces more constructive communications.
BCA Research’s latest missive extends the logic. Iran’s negotiating team is under growing pressure, he says, “while the approaching midterms are increasing pressure on the US administration.” His conclusion is not surprising: “as prices approach the upper end, escalation gives way to de-escalation.“
Crude oil prices, as shown below, have climbed roughly 20% over the past month, touching a six-week high near $90 as the US military has carried out numerous strikes and Iran has responded with missile attacks on neighboring countries. Their kinetic equilibrium theory regarding military conflict in Iran is about to be tested. Will higher prices force both sides toward talks?
We have written about how a durable decline in oil prices would flow through to CPI, take rate hikes off the table and possibly reopen the door to Fed rate cuts. BCA’s kinetic equilibrium theory offers the geopolitical trigger that might produce that decline. If the conflict continues to be swayed by oil prices, the next several weeks should bring renewed diplomatic movement rather than further escalation. However, if the kinetic equilibrium fails with prices continuing higher and escalating military actions, the markets may become less complacent about the conflict.
What To Watch Today
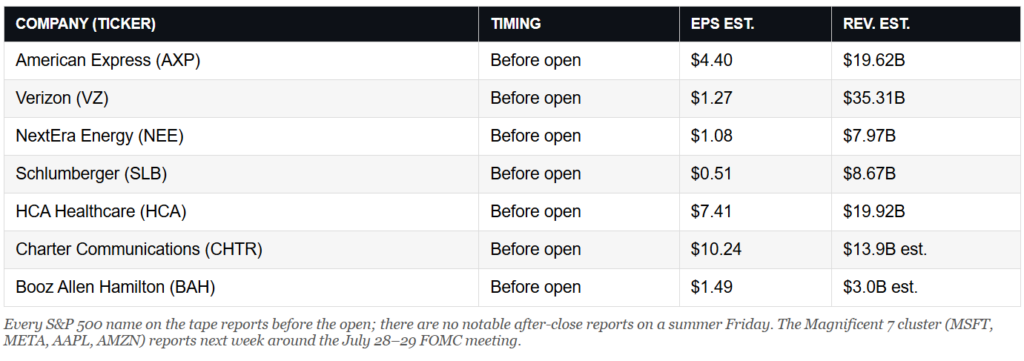
Earnings
Economy

Market Trading Update
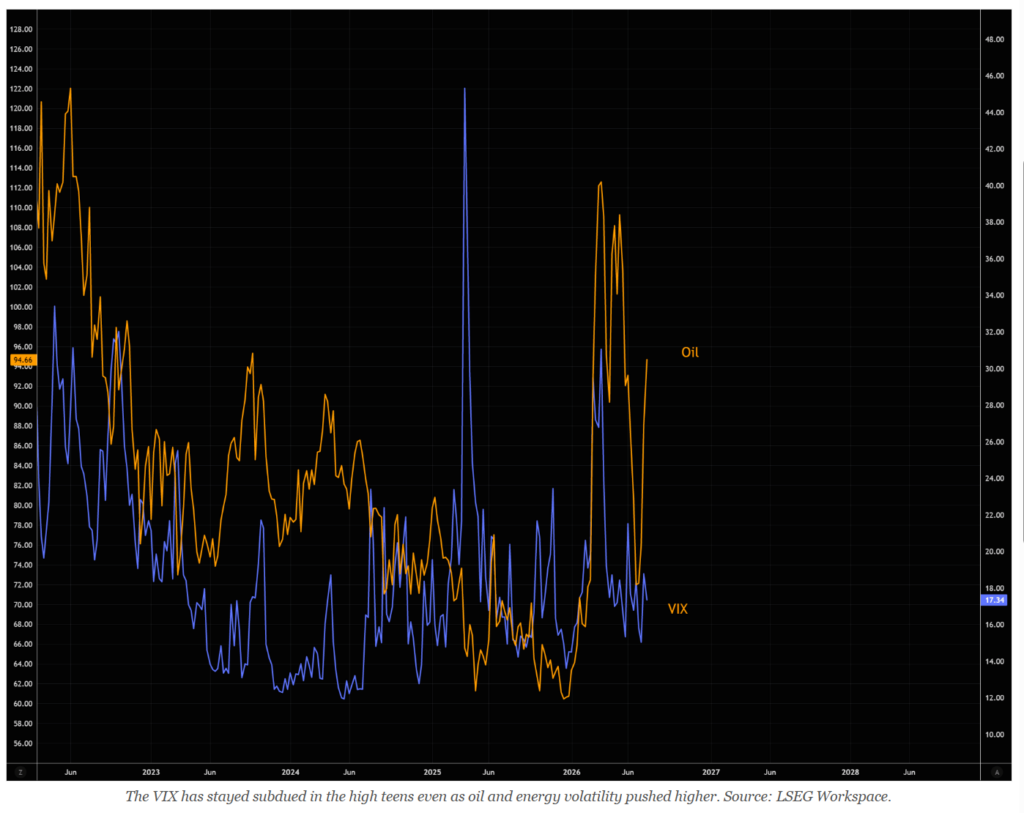
In yesterday’s report, we looked at Polymarket and why a real-money bet on the next open can sharpen our read on crowd sentiment. Today, I want to point to the one gauge that is NOT flashing any concern at all, even with a mega-cap earnings gauntlet and next week’s FOMC directly in front of us. That gauge is the VIX.
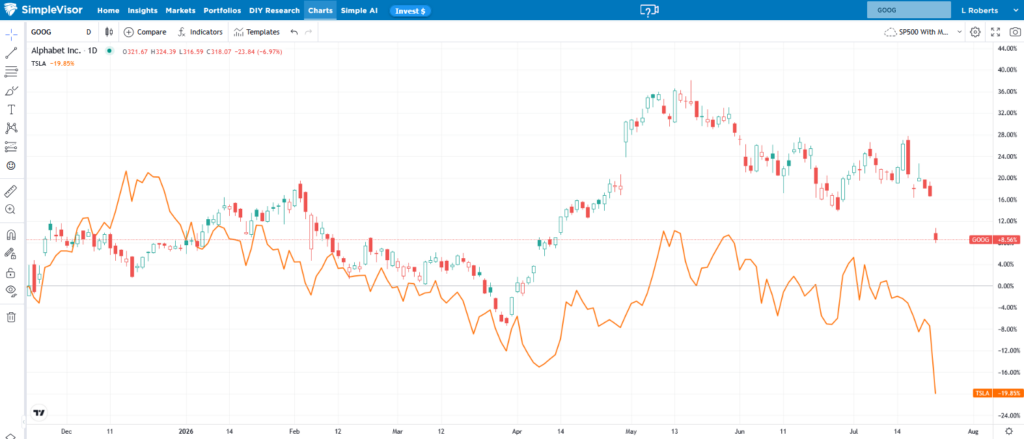
The volatility index sits in the high teens this morning, near the low end of its 12-month range, and it barely flinched while Alphabet (GOOGL) dropped 5% and Tesla (TSLA) fell 7% on their prints. Think about that. Two of the largest companies in the index had violent single-day moves, and the market’s fear gauge shrugged. Volatility is being sold into event risk, not bought ahead of it.
There is a mechanical reason. Goldman’s volatility desk has flagged one-month S&P implied correlation near its lowest level in twenty years. When correlation is this low, index volatility stays cheap because single names zig and zag against each other and wash out at the index level. That is how the VIX can sit near 19 while individual mega-caps swing 5% to 7%. The catch is that the cushion disappears fast the moment those names start moving together.
Here is the part that matters for timing. As the seasonality chart below shows, August through October is historically the highest-volatility stretch of the calendar year. We are walking straight into that window with protection priced near the lows. Man Group said it plainly this week: the VIX isn’t worried, but maybe it should be.
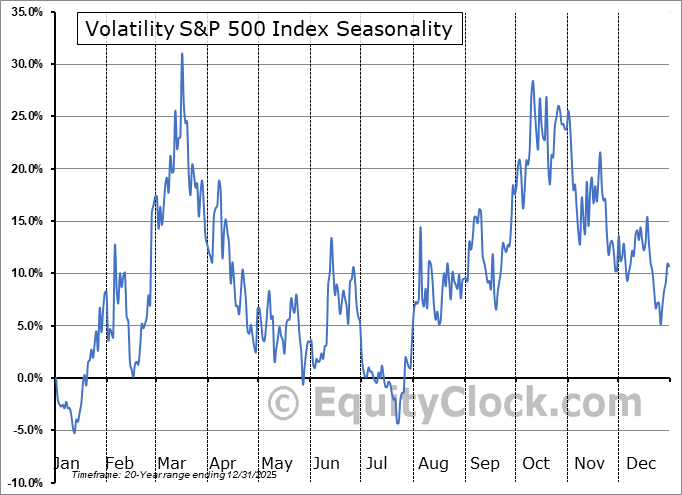
Positioning says the same thing. Nomura notes that asset managers’ VIX futures positioning sits near record lows, and historically that setup has preceded some of the strongest forward gains in VIX futures. This is not a crash call. It is an asymmetry. Howard Marks reminds us that risk is highest precisely when it feels lowest, and right now it feels very low.
So here is what we are doing. We are NOT selling volatility to reach for a little extra yield, which is exactly what this tape is tempting managers to do. In client portfolios, we keep our hedges on, and where mandates allow, we reposition as needed. We hold quality, we keep dry powder, and we let the seasonally weak window come to us. When protection is this cheap and the calendar is this heavy, you buy the umbrella before it rains. Manage risk accordingly.
Tesla And Alphabet Flop On Earnings
Alphabet and Tesla both beat revenue expectations, yet both fell sharply. Alphabet dropped over 5%, and Tesla declined by over 10%. Both companies are good examples of how investors are increasingly looking beyond traditional revenue and EPS data for guidance.
Alphabet’s headline results were strong. Google Cloud revenue surged 82% to nearly $25 billion, with the segment’s operating margin jumping to 35.6% from 20.7% a year earlier. Janus Henderson’s Alison Porter called it “one of the strongest revenue growth quarters that Alphabet has had in five years.” The problem, however, seems to be its free cash flow, which swung to negative $5.9 billion from nearly $25 billion a year ago. Furthermore, the company raised its 2026 capex guidance by about $15 billion. Alphabet’s CFO Anat Ashkenazi told analysts the increase reflects “an acceleration in the delivery of capacity to meet growing demand.”
Tesla’s story was not as good. While the automotive business grew revenue by 23%, operating expenses climbed even faster, and free cash flow turned negative for the first time in over two years. Elon Musk defended the spending toward robotaxis, Optimus, and semiconductor production, calling it “probably the fastest industrial scale-up since World War II in America.“
The market’s message across both names is consistent: Investors are currently more concerned about the amount of AI-related capex than the potential benefits down the road.
Tweet of the Day



Comments
Log in or sign up to join the conversation.