

The S&P 500 (SPX) spent the week rising, shy of a hick-up during the ECB rate announcement, and ended Friday with another record high. The index closed up 1.65% from last Friday, and up 20.7% YTD.

All things S&P 500
For the second consecutive week, the S&P 500 managed to also breach and close beyond the weekly expected move. This suggests the option market is not doing a good job of pricing risk. Unlike the previous trade week, however, the breach of the weekly expected move occurred to the upside.
You may be hearing a good deal of concern about market breadth weakening of late. The reality is that market breadth remains strong and with some 77% of S&P 500 stocks above their 200-dma. But at these levels, it has been sputtering, which is to be expected and thus breeds subjective commentary on the strength or weakness of breadth. In other words, while 77% of S&P 500 stocks are above their 200-dma, they may be moving up or down.

Market breadth is a term describing the number of stocks that are gaining or losing ground during a given period, and can provide investors insight into the broader stock market that are hidden by market-capitalization weighted indexes, like the S&P 500. Thin market breadth can portend weakness in market-cap weighted indexes, as it’s uncommon for a handful of large companies to consistently rise in value while most publicly traded firms are not.
“There are some definite warning signs in these indicators,” Mark Newton, president of Newton Advisors. I have recently changed my medium-term outlook from bullish to neutral and expect a significant pullback in stocks sometime this fall.
While it’s right not to get too bearish on a couple years of small-cap underperformance, the combined deterioration of both small and mid looks important given the rate of change of this decline in the last six to twelve months."

Newton’s other favorite indicators include the percentage of stocks on the New York Stock Exchange that are trading above their 200-day moving average. This measure shows that “nearly half of all NYSE stocks are now trading below their 200-day moving average, despite indexes being near record highs, he noted.
While Newton makes a good point, he does fail to qualify the strength of the market in relation to just last year. The chart below identifies the number of stocks within the NYSE that are trading above their 200-dma. As you can see where it ends as of Friday, it is at its highest point dating back to January of 2018. In other words, Newton would have been more validated in having concern for the market rally from the spring of 2018 through September than in the present. It's all very relative, which is why investors should keep an open mind with regards to the probability of a near-term pullback.
(Click on image to enlarge)

Craig Johnson, chief market technician at Piper Jaffray, agreed that market internals were flashing warning signs.
“Market breadth remains an ongoing concern as evidence suggests there has been a growing divergence between the recent record highs on the SPX and overall participation.
Over the last several weeks there has been a declining percentage of stocks registering new 52-week highs on the S&P 500, despite its near 10% record-high rally. Based on the divergence in breadth accompanied with weak volume and deteriorating momentum, we believe risks for a deeper pullback are growing.”
Craig Johnson makes a good point, but here's a counter point: With the S&P 500 at record levels Friday, the cumulative A/D line, which has consistently been leading price action, also made a new high. Not a guarantee of rising equity market. (Chart from Bespoke Investment Group)

It's important to remember where we are coming from. As illustrated in the chart just below, the number of stocks trading above their 200-dma was below 20% in December of 2018 and has since rallied significantly and to the present day, which is a very rare occurrence.

The chart above shows the number of times since 2004 that the number of stocks trading above their 200-dma was less than 20% and then rallied to at or above 77%, like the current day. The table below not only displays the date of the lows and dates similar to the current move off the bottom, but offers the S&P 500 returns going forward 5 years. It's obvious from the small sample size that the move is rare, but always found with positive returns 90-days and greater.

But are we overbought, you might be asking yourself? Answering that question is to not answer that question because it is highly subjective, dependent on time frames and historic data. Seeing as historic data is more uniform and a factual representation of what happened in the past and without subjectivity, that would be the best way to answer the question.
Remember, the market has been in an 18-month basing pattern since 2017 or going back more than 500 days. It has only been recently, in 2019, the market has finally broken out from this base. In doing so, we are still only talking about a small breakout of less than 5% from the base.
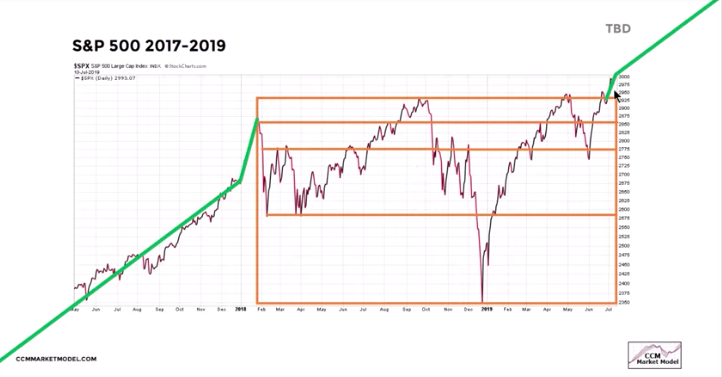
In the past, breakouts have led to significantly more gains in the future and as identified in the table above. Additionally, the market just expressed a greater than 19% decline in Q4 2018 or 213 days ago. It's very rare to have such a recent bear market, breadth thrust, breakout and suffer another bear market and sustained decline. The major low in the market occurred 213 days ago and can be compared to former major lows like that in 2000, 2007 and 2015.

In all other examples presented, the market was far more extended off their represented lows. Does this mean a correction or drawdown is improbable; NO! This is simply an exercise in defining whether or not the market is overextended historically and historically it is anything but overextended. If the historical, factual data within the charts and table presented is to be repeated, it suggests more market returns to come over the next 5 years. With that being said, we should remain mindful that in 2016, their was a drawdown of greater than 2.5% over the next 2-month period.

With the market up some 25% from its bottoms late last year and heading into the lesser performing months of the year, markets can become a bit choppy. Given the significant rally, we can also look at the market statistics for 25% rallies.

As you can see, the S&P 500’s returns over the next 2 months are somewhat random, but 3-6 month forward returns are mostly bullish. The most recent occurrence in 2012 was pretty lousy 1, 2 and 3 months later though.
Something that is a little concerning and leans on the side of overly complacent is the CBOE put/call ratio. The index put/call ratio has been very low for 4 consecutive days. The last time the index put/call ratio was consistently low, was January 2018, just before stocks crashed and volatility spiked in the following month.

I'm not insinuating the same type of volatility will arise. Conditions are extremely different in the volatility complex today than leading up to February 2018. Nonetheless, with the VIX at 12 and the put/call ratio so low, it does lend itself poorly for markets should something prove to spook investors.
In comparing the VIX's persistent low levels in 2019 with that of 2018, we can validate our prior comment along the lines of VIX futures volumes as well as technical bollinger bands. We emphasize that this is merely looking at present conditions and comparing them with the past, rather than predicting outcomes. The VIX is nothing more than its inputs force reaction thereafter.
In looking at the chart below, we can see that the upper bollinger band is turning down, presently, with the VIX below the center line (right side of chart). This was not the case in January or October 2018 where the bollinger bands were turning up and with the VIX also higher than the upper bollinger band (right and middle of chart).

Although the chart above suggests there are different conditions that present themselves more favorable with regards to market volatility, there is one ratio that does not. The VIX:VXV ratio has now fallen to the lowest level since October 2018. Remember, volatility moves from one regime to the next and we may have seen the low level volatility regime conclude in the first 6 months of the year. Does this mean we are moving into a high level volatility regime or a moderate level volatility regime? There is simply no way to no without hindsight.

There may still yet be one final plunge in the VIX before it heads higher and sustains some degree of elevation beyond that of the first half of 2019. That is likely to depend on the reaction to the FOMC rate announcement and press conference this coming week. Nonetheless and when considering the VIX:VXV ratio, given the current low levels there is usually a bullish move in the VIX near-term.

Do keep in mind that while the double-digit moves do seem extraordinary, in VIX terms they are not, especially from low levels. From the current 12% VIX reading, even a 20% move higher finds the VIX below 15. This equates to less than 1% moves on the S&P 500 daily. And speaking of the S&P 500 moving...
For the coming week, which includes the FOMC rate announcement on Wednesday and Nonfarm Payroll data for July on Friday, the weekly expected move has moved lower with the VIX, to $38/points.
Economic Data
Housing sector data continues to produce a mixed bag of results, but nothing that is pointing to a recession or of great concern. Sales of previously owned homes slipped 1.7% in June. Sales of previously-owned homes are 2.2% lower than a year ago.

Existing-home sales sold at a 5.27 million annual pace last month, down from 5.36 million in May, the National Association of Realtors said Tuesday. While Existing home sales have struggled in 2019, New home sales have proven the strength in the housing sector.
New home sales for June were reported at 646,000 on a seasonally adjusted annual rate basis (SAAR). Sales for the previous three months were revised down. This was the highest sales for June since June 2007, and annual sales in 2019 should be the best year for new home sales since 2007.

Sales in June were up 4.5% year-over-year compared to June 2018. Year-to-date (through June), sales are up 2.2% compared to the same period in 2018.
New home sales remain near their cyclical highs.
Durable-goods orders rose 2% last month, according to the Census bureau. The increase was higher than 0.7% forecast of economists polled by MarketWatch, but the decline in May also turned out to be deeper than initially reported.

This increase, up following two consecutive monthly decreases, followed a 2.3% May decrease. A key measure of business investment, known as core orders, advanced 1.9% to mark the biggest gain in almost a year and a half. Still, business investment has only risen 1% in the past year, down from as high as 8% one year earlier.
The business investment increase was largely to be expected and as Finom Group had discussed in recent State of the Market videos. The latest Philly Fed manufacturing survey suggested as much in its capital expenditures component.

The last category in the survey denotes the jump in the Philly Fed's July capital expenditures from the June period, which was likely jump started in the tail end of June. (28 to 36.9)
Despite the jump in Durable Goods orders for June, the trend is not favorable in 2019 and demands sustained business confidence and a pick-up in capital spending to create a more favorable trend in the Durable Goods data. We suggest the same sentiment with regards to the regional manufacturing data.
And then there was Friday's release of the first look at Q2 2019 GDP. Gross domestic product grew at a 2.1% annual pace from the start of April to the end of June, the government said Friday. GDP slowed from a 3.1% gain in the first three months of the year.

The print came in above the economists' estimate of 2 percent and on the back of the U.S. consumer. Much of the slowdown in GDP in the second quarter stemmed from businesses prudently drawing down their inventories of unsold goods in face of a slowing global economy.
Consumer spending jumped 4.3% after a lackluster 1.1% gain in the first quarter. Households spent more on new cars and trucks, food and drinks and clothing. Government spending, meanwhile, climbed 5% in the spring. The increase partly reflected a rebound in federal outlays after the end of a partial shutdown in January. Final sales to domestic purchasers, the best measure of demand within the United States, rose at a 3.5% annual pace in the spring, the best growth in a year.

The situation was reversed for business. Fixed investment fell 0.8% to mark the biggest drop in three and a half years. Investment slumped almost 11% for structures such as office buildings, manufacturing plants and drilling rigs. Spending on equipment rose less than 1 percent.
The value of inventories, or goods waiting to be sold, also shrank by $44.3 billion. That’s the biggest drawdown in a year and it knocked almost a full percentage point off GDP. Had inventories remained neutral, the economy would have expanded at a 3% annual pace. This inventory factor should be seen as a positive that businesses don’t have a lot of inventories piling up. Fewer inventories now mean fewer layoffs later when sales moderate. Too many recessions have resulted from an overbuild of inventories.
What also came alongside the Q2 2019 GDP result was a revision to the Q4 2018 print. U.S. GDP was not as strong as thought last year. Q4 was revised down to 1.1% from 2.2%, dropping the YoY figure to 2.5% from 3 percent.
In response to the first reporting of Q2 2019 GDP, here's what Nancy Lazar of Cornerstone Macro had to say as well as Goldman Sachs:
"Nancy Lazar estimates 2.5% 2H real GDP growth (basically steady from 1H), expecting pick-ups in capex and housing, and a bit of a slowdown in consumption. Growth will be driven by easier financial conditions (rates/dollar) and China improving."
GOLDMAN: “.. the Q2 pace of inventory accumulation (+$72bn) appears elevated relative to US business surveys and global industrial trends, and we expect this component to weigh on third-quarter growth. Taken together, we lowered our Q3 GDP forecast by 0.2pp to +1.7% ..”
For this week, the market will likely still be focused on earnings, but the FOMC rate announcement will be the key event of the week. There is no significant economic data to be released in the U.S. on Monday, although starting Tuesday we'll get a better gauge on the Fed's price stability mandate when the Personal Income and Expenditures (PCE) data is released.

Big Easy/ing Week
The FOMC is largely expected to cut its Federal Funds Rate (FFR) by 25 bps at the upcoming meeting this Wednesday afternoon. An easing rate environment with S&P 500 EPS still rising YoY, albeit slightly, suggests the market should continue to perform well in 2019 and as financial conditions continue to loosen. But do keep in mind what we witnessed just this past week with the European Central Bank signaling they would also ease monetary policy at the next meeting. As soon as ECB President Mario Draghi started discussing the economic outlook...

"Those who were looking for reassurance that a broad-based policy easing by the European Central Bank (ECB) is in the works were not disappointed by Thursday’s meeting of the Governing Council (GC). The ECB took several critical steps towards a package of easing measures, likely to be initiated in September 2019. Besides adopting a formal easing bias, the GC tasked committees to examine broad-based policy options, including the design of a tiering system and options of the size and composition of possibly renewed asset purchases. In sum, a first rate cut in September combined with tiering is all but a foregone conclusion. A decision on asset purchases is now highly likely, but it may come only in December, depending on the degree of the economic slowdown and how quickly a consensus in the GC can be forged."
So while it is very likely that the ECB eases at the next meeting, which was/is the expectation all along, global equities still fell on Thursday. Something to keep in mind for the coming week and even when the Fed delivers a rate cut. On the brighter side of things, however, is a recently resurrected statistic regarding rate cuts and the S&P 500 from FundStrat: Since 1971, when the Fed makes its first Fed cut and LEIs are still positive... stocks have risen 100% of the time 3M/6M/9M and 12M later.

So while we can't predict the market's reaction right after the Fed speaks; history does suggest a strong market over the next 12 months.
Most economists, analysts and investors are expecting a 25 bps insurance rate cut when the FOMC makes its announcement on Wednesday. Finom Group is of the same opinion as the current economic outlook does not demand more and more would likely spook the markets and demand a more dour outlook on economic conditions from the FOMC. A recent note from Oppenheimer's Ari Wald suggests the Fed usually only eases for the first time after a tightening period by 50 bps when the economy is already in a recession, which is not the case presently.

A Fed rate cut's objective is likely to sure-up business sentiment and spur economic growth further, while easing financial conditions. Financial conditions are already quite easy, but will likely continue to improve as rates decline further.

Fund Flows Still Mehhhh
According to Lipper Weekly FundFlows report, for the first week in three, equity ETFs witnessed net outflows, handing back a little more than $2.7 billion for the most recent fund-flows week. Authorized participants (APs) were net sellers of domestic equity ETFs (-$3.0 billion), also for the first week in three. Meanwhile, non-domestic equity ETFs witnessed net inflows for the second week in a row, but attracted just $271 million this past week. SPDR Gold (GLD, +$875 million) and Goldman Sachs ActiveBeta U.S. Large-Cap Equity ETF (GSLC, +$791 million) attracted the largest amounts of net new money of all individual equity ETFs. At the other end of the spectrum, SPDR S&P 500 ETF (SPY, -$5.5 billion) experienced the largest individual net redemptions and Invesco QQQ Trust 1 (QQQ, -$1.3 billion) suffered the second largest net redemptions of the week.
So far for the fiscal year of 2019, the market has born witness to a net outflow of -$93.1b (Lipper).

The trend out of equities and into bond funds has been a persistent trend throughout 2019. 2019 Bond fund flows are largest observed this decade, further aiding the lower yield regime.

What fund flows don't define is market liquidity and when market liquidity is low, moves up or down can be sustained for longer than anyone can predict, based on fund flow data. With this in mind, let's review asset class performance across the globe year-to-date and just this past week.

For 2019, the S&P 500 has led all other equity and bond markets. Maybe this is why hedge funds have leveraged up since June. In fact, this past Wednesday was the largest day of buying in over 3 weeks, according to the Morgan Stanley PB Content team.

As pointed out by Morgan Stanley, is there much more room for these market participants to lever up? While hedge funds and Commodity Trading Advisers are all leveraged up, buybacks are the real driver of equities over the last 2 years. Here are the latest notes from Morgan Stanley regarding buybacks
- Increase in announced buybacks from Technology and Financial sector companies over the past month led Buybacks index to a new all-time high.
- In the last few sessions we have seen a reversal in the buying trends in the Prime Finance book for the Buybacks baskets.
- Trading activity as well as positioning seems to be cooling-off for the Buybacks baskets in the past few days. This is mainly driven by fresh short positions being added in.
- Trading momentum in Buybacks basket deteriorated sharply in the last 10 days.

Q2 2019 Earnings Outlook
It's definitely getting better, but slowly and week-by-week as it pertains to Q2 earnings forecasts. With roughly 50% of companies having reported, S&P 500 earnings are up 2% YoY, the slowest growth rate in 3 years.

- The Information Technology sector (+10.6%) sector is reporting the largest positive (aggregate) difference between actual earnings and estimated earnings. Within this sector, Micron Technology ($1.05 vs. $0.79), PayPal Holdings ($0.86 vs. $0.69), Intel ($1.06 vs. $0.88), Red Hat ($1.00 vs. $0.87), and Microsoft ($1.37 vs. $1.21) have reported the largest positive EPS surprises.
- The Financials (+7.5%) sector is reporting the second largest positive (aggregate) difference between actual earnings and estimated earnings. Within this sector, Jefferies Financial Group ($2.14 vs. $0.24), SVB Financial Group ($6.08 vs. $5.02), Goldman Sachs ($5.81 vs. $4.89), Capital One Financial ($3.37 vs. $2.89), and JPMorgan Chase ($2.82 vs. $2.50) have reported the largest positive EPS surprises.
- The Communication Services sector (-1.0%) is reporting the largest negative (aggregate) difference between actual earnings and estimated earnings. Within this sector, Facebook ($0.91 vs. $1.88) has reported the largest negative EPS surprise.
Moreover, the negative earnings estimates may have found a bottom according to the latest notes from Goldman Sachs, and recently turned higher.

Most companies that have released earnings to-date have beaten analysts' estimates. In terms of earnings, the percentage of companies reporting actual EPS above estimates (77%) is above the 5-year average. In aggregate, companies are reporting earnings that are 5.4% above the estimates, which is also above the 5-year average. In terms of sales, the percentage of companies (61%) reporting actual sales above estimates is above the 5-year average. In aggregate, companies are reporting sales that are 1.2% above estimates, which is also above the 5-year average.
One of those companies which beat on both the top and bottom line this past week for the Q2 period was Coca-Cola (KO). Finom Group (for whom I am employed) issued a trade alert on shares of KO in Q1 this year, for Premium Members. After better than expected results, we closed this trade with a better than 10% return on capital invested.

After raising its revenue forecast Tuesday, Coca-Cola is feeling positive heading into the second half of 2019 as concerns about economic uncertainty wane.
“We saw some clouds on the horizon, too,” CEO James Quinceysaid on CNBC’s “Squawk on the Street. ” “But the storm never arrived, so by sticking to our plan, by executing against our strategy, we’ve been able to deliver stronger momentum than even we were expecting.”
Coca-Cola's CEO comments on the "storm never arriving" is mirrored in the fears of an earnings recession that hasn't developed in 2019 or to-date. Q1 earnings grew a little more than 1% and Q2 results are trending in-kind.
In addition to the storm not arriving in Q2 2019, shares of the beverage giant were up 5% after the company raised its revenue forecast following its second-quarter earnings topping estimates. Coke now expects organic revenue growth of 5% rather than 4 percent.
And Coca-Cola wasn't the only company that raised estimates as tracked through the reporting period by J.P. Morgan Chase. The following chart shows that many companies have raised their FY EPS guidance.

During the week, 168 S&P 500 companies (including 7 Dow 30 components) are scheduled to report results for the second quarter. It should prove another eventful week with reports from the likes of Apple Inc. (AAPL) and Proctor & Gamble (PG) on Tuesday and rounding out the week with Exxon Mobil (XOM).

FactSet now forecasts Q2 2019 EPS to decline by -2.6%, an upward revision of .1% from the prior week. The blended revenue growth rate for the second quarter is 4.0% today, which is above the revenue growth rate of 3.6% last week. Positive revenue surprises reported by companies in multiple sectors (led by the Energy sector) were responsible for the increase in the overall revenue growth rate during the week. If 4.0% is the final growth rate for the quarter, it will mark the lowest revenue growth rate for the index since Q3 2016 (2.7%). The forward 12-month P/E ratio is 17.1, which is above the 5-year average and above the 10-year average.

For the second half of 2019, analysts see a decline in earnings in the third quarter and mid-single-digit growth in earnings in the fourth quarter.
- For Q3 2019, analysts are projecting a decline in earnings of -1.9% and revenue growth of 3.2%. For Q4 2019, analysts are projecting earnings growth of 4.9% and revenue growth of 4.0%.
- For CY 2019, analysts are projecting earnings growth of 1.7% and revenue growth of 4.4%.
- For Q1 2020, analysts are projecting earnings growth of 9.2% and revenue growth of 5.9%.
- For Q2 2020, analysts are projecting earnings growth of 12.6% and revenue growth of 6.6%.
Aggregate Estimates and Revisions from Refinitiv:
- Second quarter earnings are expected to increase 0.5% from 18Q2. Excluding the energy sector, the earnings growth estimate is 1.2%.
- Of the 218 companies in the S&P 500 that have reported earnings to date for 19Q2, 75.2% have reported earnings above analyst expectations. This compares to a long-term average of 65% and prior four quarter average of 76%.
- 19Q2 revenue is expected to increase 3.6% from 18Q2. Excluding the energy sector, the growth estimate is 4.0%.

Bank of America Merrill Lynch recently recent notes to clients with their outlook for earnings beyond the Q2 2019 period and into 2020. See notes below:

"Looking further out, BofAML Global Research is a bit less optimistic, projecting full-year EPS growth of 1.9% in 2019 and 6.7% in 2020, which falls below consensus (Exhibit4). Importantly, earnings revisions trends appear to be looking better for domestically oriented sectors relative to multinationals, with the 3-month earnings revision ratio for pure domestics in the S&P 500 indicating more upgrades than downgrades in estimates, while multinationals have experienced the opposite.
Headline earnings may grab attention, but investors will also be looking to parse information pertaining to sales, cost pressures and guidance to inform forward-looking views. Revenue growth typically tracks nominal GDP but is expected to slow considerably, while stable margins could indicate productivity in the wake of stronger wages but lower unit labor costs. Management guidance will be critical to forward expectations as investors will key in on the expected impact of macro events, including trade and central bank policy."

Investor Takeaways
Going into the final trading week of the month, investors have already seen the market rally through much of July. The S&P 500 12-month forward looking multiple at roughly 17X does value decelerating earnings on a YoY basis rather richly, but only if we use the average PE ratio over the last 10 years.
Price-to-earnings ratios are a reflection not just of earnings, but also interest rates. When the 1966 to 1982 bear market ended, interest rates were in the double-digits and P/E ratios were in the single digits. The bull market began with a 7X Earnings ratio for the S&P 500 in 1982 and ended in 2000 with over 30X earning ratio. Look at how much earnings grew over that period and you cannot help but come to the conclusion that 75% of stock price gains were the result of multiple expansion; only 25% of the gains were the result of increasing profits.

Since June 2009, at the end of the Great Financial Crisis, earnings have grown 203%, the price of the S&P 500, however, has risen by 232 percent. There has been surprisingly little multiple expansion in the last 10 years. The effect of human psychology on the market is quite extreme when comparing past bull markets to those of the present.
With the PE ratio being extended when compared to the last 10 years, it forces many investors and analysts to believe a correction will take place near-term. This is the nature of recency bias, but it's also understood to be a self fulfilling prophecy as defined by the 10-year average PE ratio. So does this mean the PE ratio can't get to 18X or better, NO! But until it does, more and more investors and analysts will likely herald a pullback in valuations.
“I thought 2,950 would be a ceiling for this year, and we are already higher than it,” Bob Doll, chief equity strategist and senior portfolio manager at Nuveen, told MarketWatch, predicting the “market will go nowhere” in the second half.

“Price-to-earnings ratios have gone from 13 to 17.4, and earnings estimates are still too high for next year,” Doll said, adding that higher valuations and future reductions in earnings estimates will be headwinds for stocks in the second half, along with a Federal Reserve policy that he predicts will be more hawkish than the market expects, unless a more damaging economic downturn materializes.

A potential sell-off would be driven by a downward revision in earnings forecasts for next year, predicted Jasslyn Yeo, global market strategist at the asset management giant.
Yeo told CNBC’s “Street Signs” she “won’t put a number” to the sell-off that she’s predicting, but said there will be “significant downside risk” for stock prices.
"After that expected Fed move, investors are set to turn their attention to other factors that influence stock prices, such as corporate earnings. Many analysts would start tweaking their earnings forecasts for 2020 in the second half of this year, so that would determine how stocks perform in the coming months. We think there could be a risk that (earnings) would head downwards."
The biggest current mistake from most analysts is predicting the extent of an indicator move from the first change in direction. This is usually accompanied by a chart of past peaks with a prediction for the current downturn. We saw this most recently in the Morgan Stanley MSBCI Index that was plastered on social media and on CNBC. Remember this chart from mid-June; it received a lot of attention?

Morgan Stanley’s Business Conditions Index, which captures turning points in the economy, fell by 32 points in June, to a level of 13 from a level of 45 in May. This drop is the largest one-month decline on record and the lowest level since December 2008 during the financial crisis, according to the firm.
June’s conditions index reading showed notable declines in hiring, hiring plans, CAPEX plans and business conditions exceptions, Morgan Stanley said.
"The manufacturing subindex business conditions fell sharply to zero, “a decline that was likely exaggerated by the recent turn lower in oil prices, while marking the lowest level for the subindex on record."
So what's the point of rehashing this abysmal decline in the MSBCI from June? Indicators do not move smoothly. The switches can be sharp, especially if news driven, which is what drove the index sharply lower from May, when tariffs were increased on China and threatened against Mexico. But good luck finding any update on the MSBCI since June. Negative news and economic readings get far more attention than the positive readings or news.

As we can see, the reversal in the MSBCI is the reason we can't find the headline in the media, it's far too positive of a reversal and reduces the recession risk previously herald by the permabears and Morgan Stanley. Thank you for tuning in again to my extensive weekly Research Report and have a great trading week all!
Comments
Log in or sign up to join the conversation.