

Energy stocks spent the decade of 2010 to 2020 mired in weakness… but is that trend coming to an end?
The past two years have seen the Energy Sector (XLE) surge as Crude Oil has rallied back over $80.
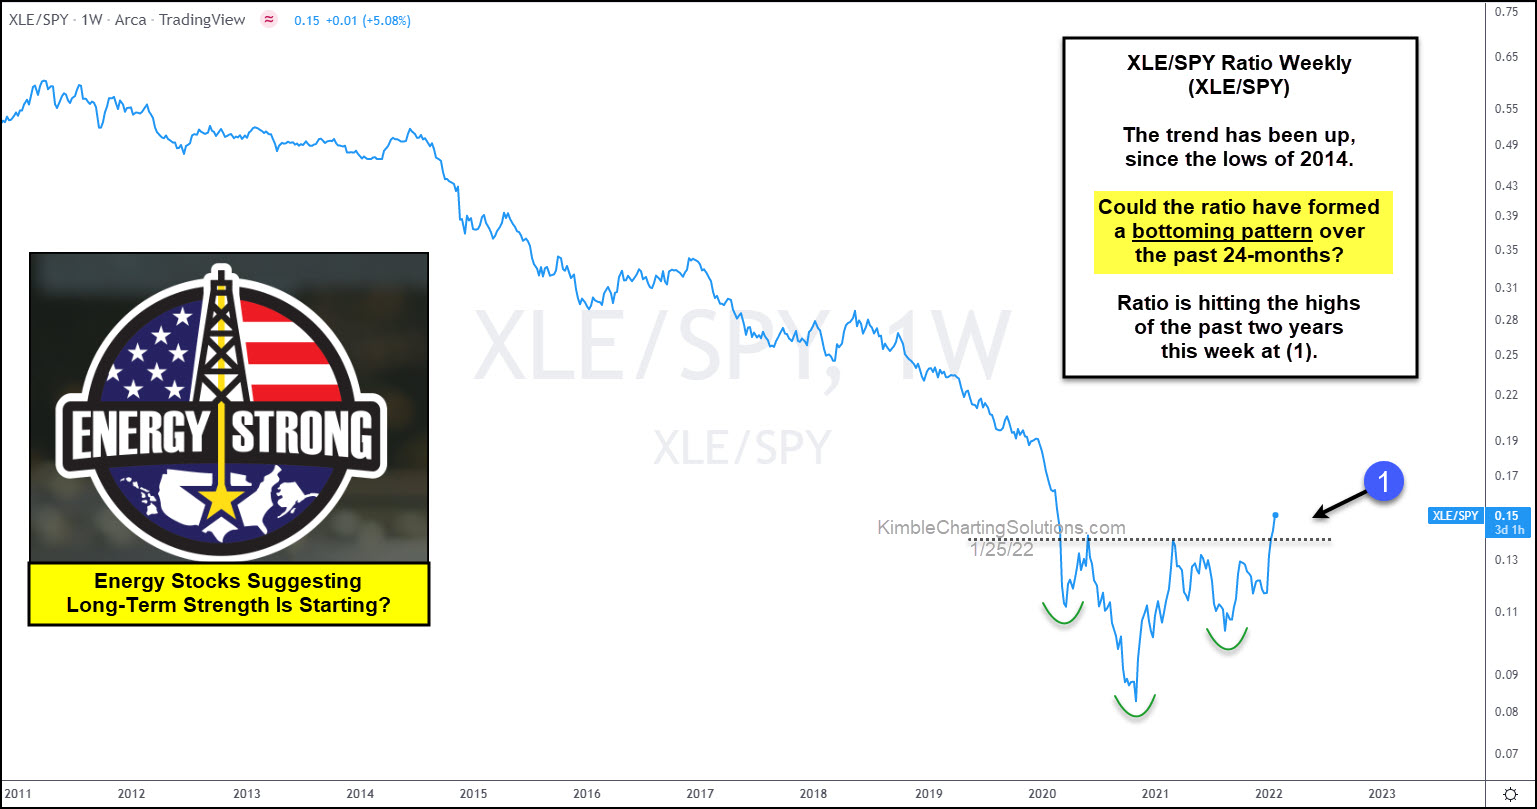
Today’s chart is a long-term “weekly” ratio chart of the Energy Sector to S&P 500. And this chart may be illustrating why energy stocks may be ready to out-perform in the weeks/months/years ahead.
As you can see, the XLE/SPY ratio formed a strong bottoming pattern over the past 24 months. And now the ratio is breaking out to new 2-year highs at (1). Looks like energy stocks are suggesting long-term strength is starting.
(Click on image to enlarge)



Comments
Log in or sign up to join the conversation.