
The Producer Price Index year-over-year inflation declined from 3.0 % to 2.6 %.

Analyst Opinion of Producer Prices
The Producer Price Index declined year-over-year. Food prices did moderate. Here is what the BLS said in part:
A major factor in the April advance in prices for final demand services was the index for machinery, equipment, parts, and supplies wholesaling, which climbed 0.9 percent. The indexes for services related to securities brokerage and dealing (partial), residential real estate loans (partial), airline passenger services, and wireless telecommunication services also moved higher. In contrast, prices for traveler accommodation services fell 3.2 percent. The indexes for health, beauty, and optical goods retailing; legal services; and apparel wholesaling also decreased.
Among prices for final demand goods in April, the index for tobacco products jumped 2.6 percent. The indexes for carbon steel scrap; search, detection, navigation, and guidance systems; pharmaceutical preparations; diesel fuel; and prepared poultry products also increased. Conversely, prices for fresh and dry vegetables fell 17.8 percent. The indexes for chicken eggs, beef and veal, residential electric power, and basic organic chemicals also moved lower.
The PPI represents inflation pressure (or lack thereof) that migrates into consumer price.
The market had been expecting (from Bloomberg):
| month over month change | Consensus Range | Consensus | Actual |
| PPI-Final Demand (PPI-FD) | 0.2 % to 0.5 % | +0.3 % | +0.1 % |
| PPI-FD less food & energy (core PPI) | 0.1 % to 0.3 % | +0.2 % | +0.2 % |
| PPI-FD less food, energy & trade services | 0.2 % to 0.4 % | +0.4 % | +0.1 % |
The producer price inflation breakdown:
| category | month-over-month change | year-over-year change |
| final demand goods | +0.0 % | |
| final demand services | +0.1 % | |
| total final demand | +0.1 % | +2.6 % |
| processed goods for intermediate demand | +0.5 % | +4.7 % |
| unprocessed goods for intermediate demand | +0.9 % | +3.2 % |
| services for intermediate demand | +0.3 % | +3.1 % |

z ppi1.png
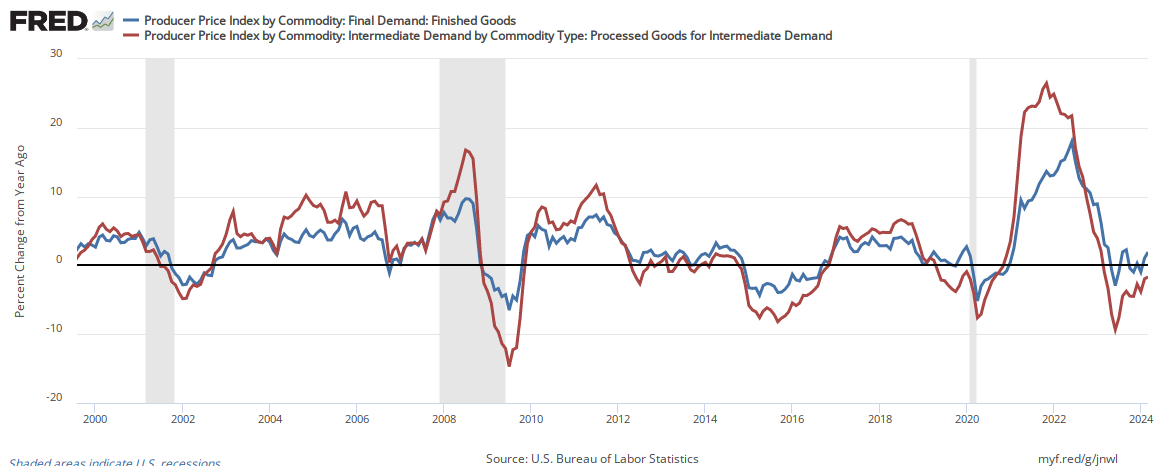
In the following graph, one can see the relationship between the year-over-year change in intermediate goods index and finished goods index. When the crude goods growth falls under finish goods - it usually drags finished goods lower.
Percent Change Year-over-Year - Comparing PPI Finished Goods (blue line) to PPI Intermediate Goods (red line)
Econintersect has shown how pricing change moves from the PPI to the Consumer Price Index (CPI).
Comparing Year-over-Year Change Between the PPI Finished Goods Index (blue line) and the CPI-U (red line)

The price moderation of the PPI began in September 2011 when the year-over-year inflation was 7.0%.
Caveats on the Use of Producer Price Index
Econintersect has performed several tests on this series and finds it fairly representative of price changes (inflation). However, the headline rate is an average - and for an individual good or commodity, this series provides many sub-indices for a specific application.
A very good primer on the Producer Price Index nuances can be found here.
Because of the nuances in determining the month-over-month index values, the year-over-year or annual change in the PPI index is preferred for comparisons.
There is a moderate correlation between crude goods and finished goods. Higher crude material prices push the finished goods prices up.


Comments
Log in or sign up to join the conversation.