

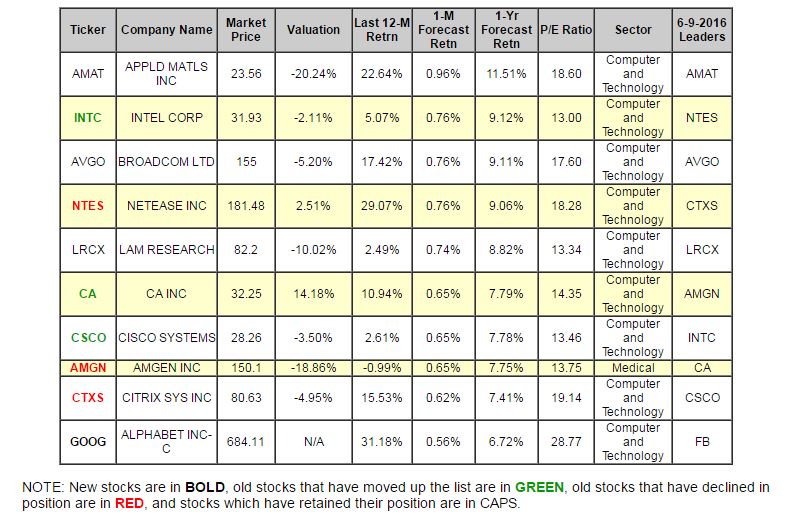
We can use our data to track individual stocks, industries, sectors, and indices. We present key metrics for the top picks in the Nasdaq 100. The companies listed below represent the top-ten BUY and STRONG BUY stocks within the index. They are presented below according to their one-month forecast target prices.
We don't have much change among our leaders since the last time we presented the top Nasdaq picks earlier this month.. Google just makes it into the top ten and replaces Facebook in doing so. Applied Matterials retains the number one spot- with Broadcom and LAM Research retaining their thrid and fifth-place positions respectively. Intel shoots up into the number two position with CA Inc and Cisco Systems moving up two spots each. What goes up must come down of course, and this week we see Netease, Amgen, and Citrix declining a few spots each. As is to be expected with the Nasdaq, once again, the list is dominated by tech companies.
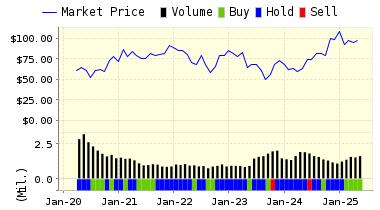
Computer Associates International is one of the world's largest information technology management software companies, unifies and simplifies the management of enterprise-wide IT. The Company's software & expertise unify & simplify complex IT environments in a secure way across the enterprise for greater business results.Below is today's data on Computer Associates (CA):
Recommendation: We continues with a BUY recommendation on Computer Associates Inc. for 2016-06-29. Based on the information we have gathered and our resulting research, we feel that Computer Associates Inc. has the probability to OUTPERFORM average market performance for the next year. The company exhibits ATTRACTIVE Company Size and Momentum.
|
ValuEngine Forecast |
||
|
Target |
Expected |
|
|---|---|---|
|
1-Month |
32.46 | 0.65% |
|
3-Month |
33.41 | 3.61% |
|
6-Month |
34.62 | 7.34% |
|
1-Year |
34.76 | 7.79% |
|
2-Year |
40.71 | 26.23% |
|
3-Year |
41.90 | 29.93% |
|
Valuation & Rankings |
|||
|
Valuation |
14.18% overvalued |
Valuation Rank |
 18 18 |
|
1-M Forecast Return |
0.65% |
1-M Forecast Return Rank |
90 |
|
12-M Return |
10.94% |
Momentum Rank |
79 |
|
Sharpe Ratio |
0.31 |
Sharpe Ratio Rank |
77 |
|
5-Y Avg Annual Return |
6.46% |
5-Y Avg Annual Rtn Rank |
74 |
|
Volatility |
20.91% |
Volatility Rank |
73 |
|
Expected EPS Growth |
4.60% |
EPS Growth Rank |
32 |
|
Market Cap (billions) |
14.28 |
Size Rank |
93 |
|
Trailing P/E Ratio |
14.35 |
Trailing P/E Rank |
76 |
|
Forward P/E Ratio |
13.72 |
Forward P/E Ratio Rank |
59 |
|
PEG Ratio |
3.12 |
PEG Ratio Rank |
13 |
|
Price/Sales |
3.55 |
Price/Sales Rank |
26 |
|
Market/Book |
2.66 |
Market/Book Rank |
40 |
|
Beta |
1.02 |
Beta Rank |
44 |
|
Alpha |
0.06 |
Alpha Rank |
76 |
Market Overview
|
Summary of VE Stock Universe |
|
|
Stocks Undervalued |
51.36% |
|
Stocks Overvalued |
48.64% |
|
Stocks Undervalued by 20% |
21.71% |
|
Stocks Overvalued by 20% |
16.55% |
Sector Overview
|
Sector |
Change |
MTD |
YTD |
Valuation |
Last 12-MReturn |
P/E Ratio |
|
Basic Materials |
1.22% |
6.34% |
36.92% |
12.03% overvalued |
19.44% |
29.53 |
|
Oils-Energy |
-0.20% |
6.19% |
16.91% |
10.10% overvalued |
-28.17% |
23.91 |
|
Consumer Staples |
0.43% |
2.24% |
7.25% |
9.96% overvalued |
5.84% |
23.98 |
|
Utilities |
0.84% |
2.87% |
9.14% |
6.85% overvalued |
4.88% |
22.76 |
|
Multi-Sector Conglomerates |
0.46% |
2.28% |
7.03% |
5.90% overvalued |
-6.59% |
18.35 |
|
Industrial Products |
0.55% |
3.26% |
8.91% |
5.37% overvalued |
-7.08% |
21.58 |
|
Aerospace |
-0.08% |
2.13% |
-0.64% |
2.02% overvalued |
-2.14% |
19.12 |
|
Computer and Technology |
0.18% |
1.82% |
9.01% |
0.82% overvalued |
-8.42% |
28.12 |
|
Business Services |
0.40% |
1.97% |
13.40% |
0.34% undervalued |
-8.54% |
23.29 |
|
Finance |
0.28% |
0.97% |
3.34% |
1.20% undervalued |
-3.19% |
16.13 |
|
Construction |
0.81% |
1.74% |
22.65% |
1.38% undervalued |
-1.39% |
21.31 |
|
Consumer Discretionary |
0.24% |
1.56% |
4.17% |
2.20% undervalued |
-10.38% |
23.56 |
|
Medical |
0.62% |
2.91% |
-2.92% |
4.01% undervalued |
-19.87% |
27.42 |
|
Transportation |
0.54% |
2.79% |
4.68% |
5.18% undervalued |
-24.78% |
13.98 |
|
Auto-Tires-Trucks |
0.17% |
0.82% |
0.56% |
7.03% undervalued |
-14.26% |
12.20 |
|
Retail-Wholesale |
0.24% |
1.98% |
-1.70% |
9.05% undervalued |
-11.16% |
22.54 |
Valuation Watch: Overvalued stocks now make up 48.64% of our stocks assigned a valuation and 16.55% of those equities are calculated to be overvalued by 20% or more. Eight sectors are calculated to be overvalued.
Comments
Log in or sign up to join the conversation.