

The Apple stock price (AAPL) has reached an interesting decision zone. Although Warren Buffet recently sold a part of his AAPL stocks, he still owns a substantial amount of stock.

The recent $28 decline represents a 20% discount compared to the recent high at $145 in January 2021. Are there signs for a bullish recovery or trend? Let’s review.
Price Charts and Technical Analysis
(Click on image to enlarge)
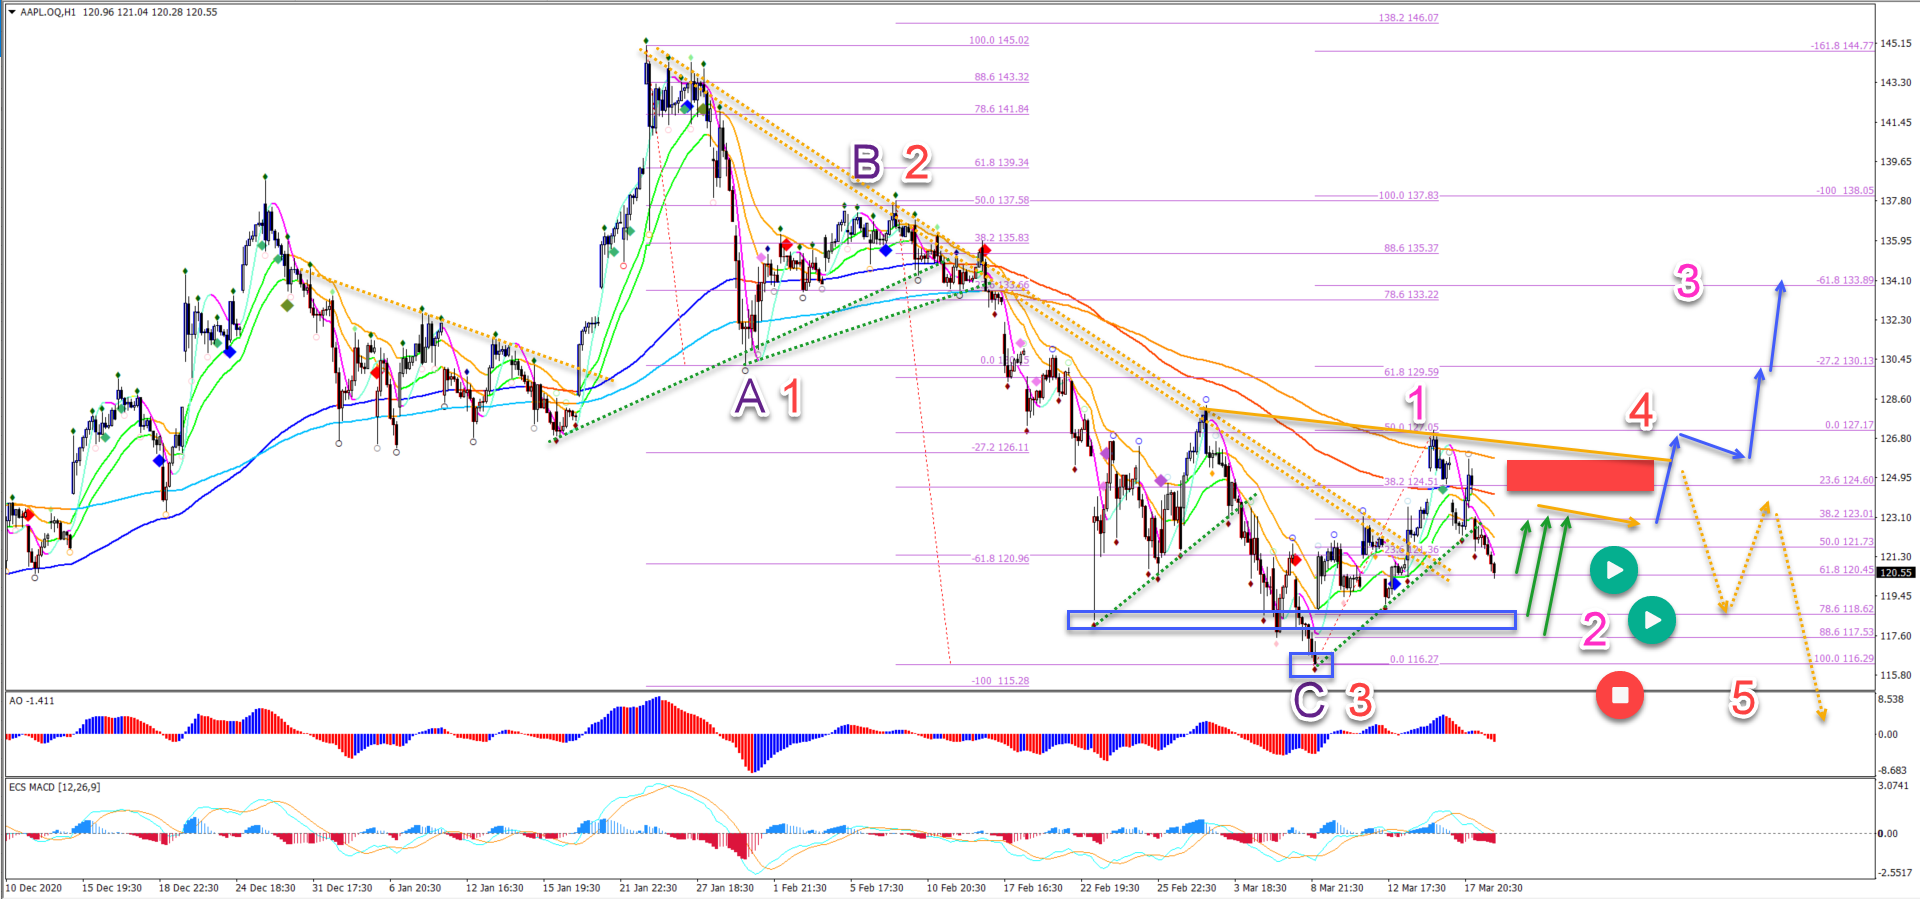
The main question is whether price has completed a bearish ABC (purple) pattern at the -100% Fib target or is price developing a larger bearish 5 wave pattern (red). Our main analysis favours the ABC down and now a 5 wave up (pink).
- Apple made a bearish bounce at the 50% Fibonacci resistance.
- Price is now testing the Fibonacci support levels. A wave 2 (pink) could bounce at any of these Fibs.
- Only a break below the bottom at $116.27 invalidates (red circle) the wave 123 (pink).
- A bullish breakout above the resistance zone (red box) confirms the upside (blue arrows) towards the Fibonacci targets – if not higher.
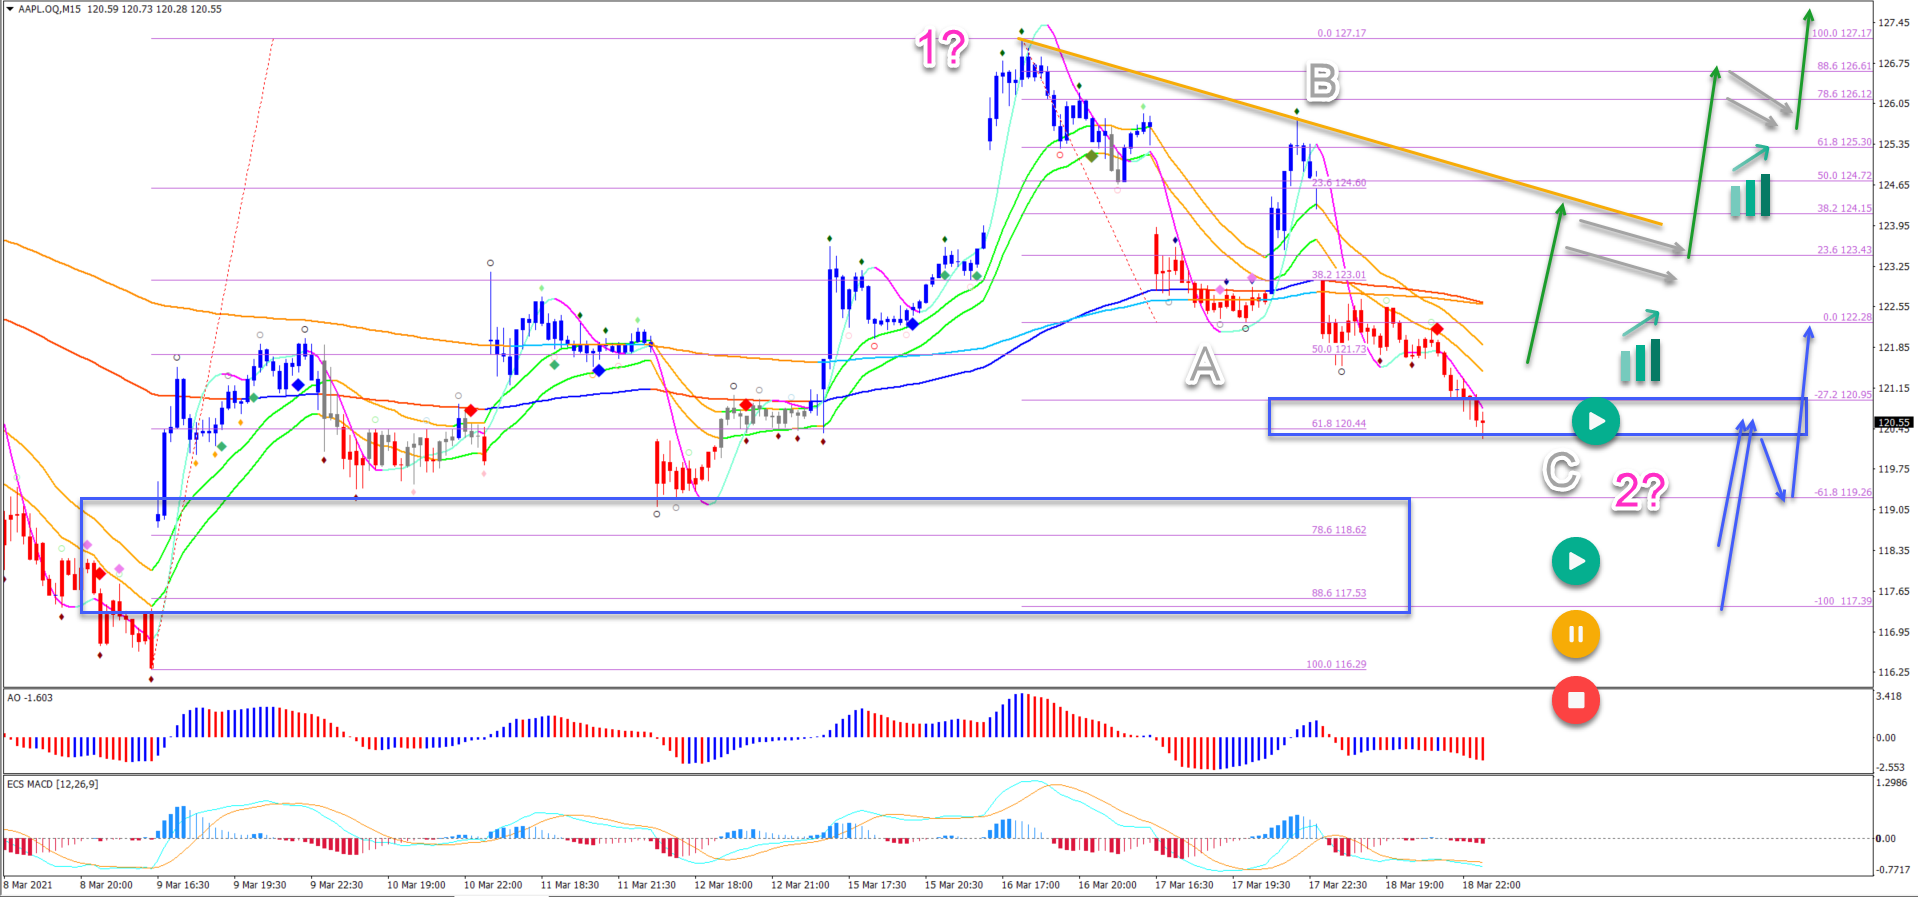
On the 15 minute chart, price action could be building a bearish ABC (grey) pattern. But the upside does not look as strong.
- With a choppy and corrective wave 1, the wave patterns are unfortunately not as clear as we like.
- The bearish price action, however, is also corrective and does like an ABC down.
- The main decision will occur when price tests the Fibs. A bullish bounce (blue arrows) could confirm a reversal.
- Another confirmation could arrive if price action is able to break above the resistance zone for a bullish push (green arrows).
- A deeper push invalidates the immediate uptrend at least (red circle).
(Click on image to enlarge)



Comments
Log in or sign up to join the conversation.