

Let’s tackle the Apple (AAPL) stock and provide you with a deep dive on the technical analysis.
Overall the stock sits at 89% of its 52 week range and right on the cusp of new all-time highs here ($243.42 to $345.34). It has a rising trend-line off of its June lows that has held strong, but not overly crazy with how difficult of a time it has had since early August detaching itself from it. There hasn’t been what I would call a hard bounce off of that level, but instead riding the coat-tails of the trend-line higher.
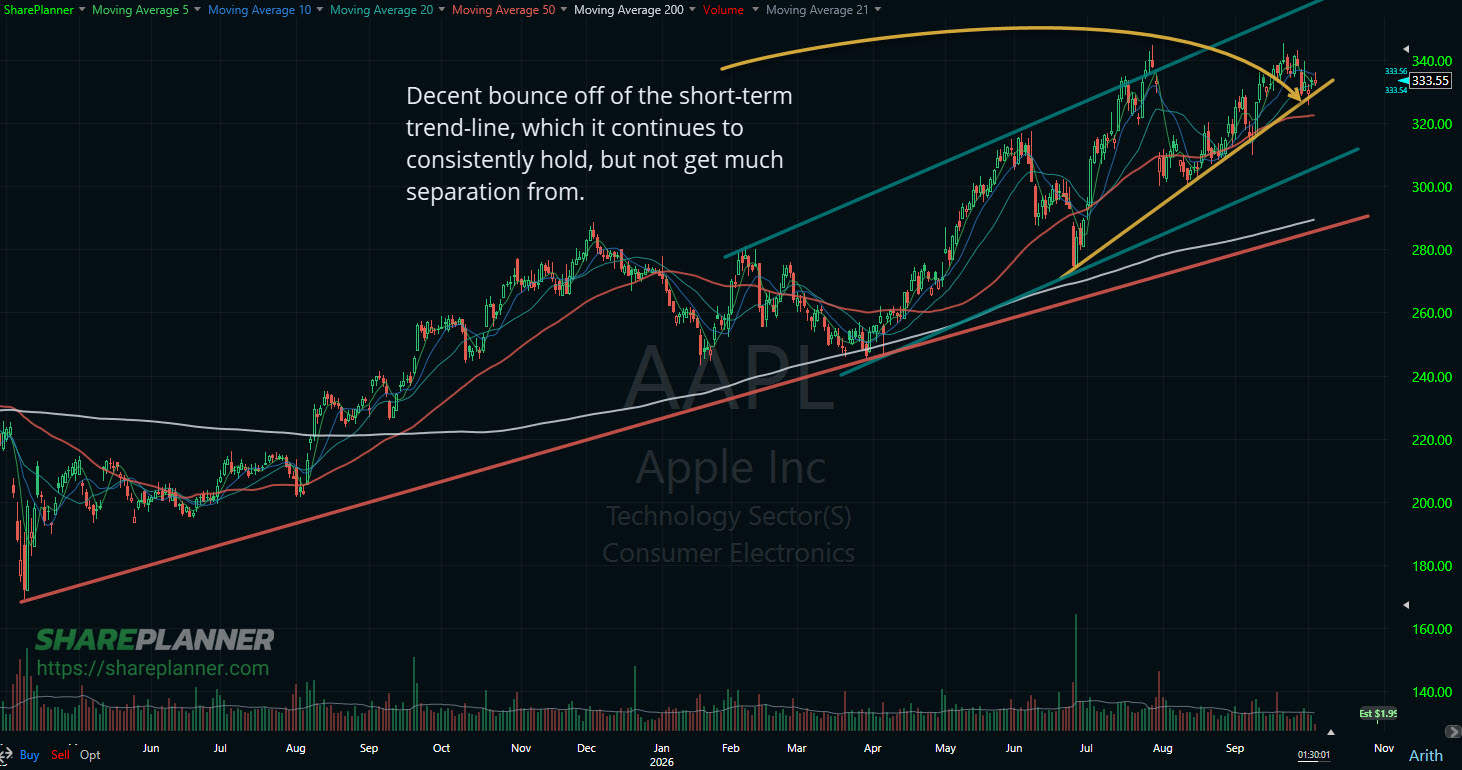
Bug enveloping that rising trend-line is a rising channel as well. Any strong bounce off the rising trend-line would likely see AAPL retest its upper channel band and form new all-time highs in the process. And that is an area that has acted as heavy resistance in the past. I think even more so, what wouldn’t surprise me is with the lack of bounce off of the rising trend-line, if it broke that support, and pulled back to the lower channel band for a potential bounce play.
Now what does the record say? SharePlanner’s Trading Block Terminal has tracked Apple’s chart patterns since 1980, along with more than 3,300 stocks and ETFs
it completes chart patterns more often than 77% of them;
its breakouts have followed through better than 59% of them;
over the past year it has outperformed 60% of the Technology stocks I track;
it is also calmer than 78% of them, with smaller overnight gaps than 83% and a narrower daily price range than 80%.
In plain terms, Apple hands you plenty of setups, and it tends to move in an orderly way.
Tie all that together, you have a stock that has consistently done well with pattern performance, but does so in a tighter price range and less volatility. That has been the case with Apple for years now as it has managed to find itself as more of a value tech play that tilts slightly defensive.



Comments
Log in or sign up to join the conversation.