
Apple Inc. (AAPL) is engaged in designing, manufacturing and marketing mobile communication and media devices, personal computers, and portable digital music players. The Company's products and services include iPhone, iPad, Mac, iPod, Apple TV, a portfolio of consumer and professional software applications, the iOS and Mac OS X operating systems, iCloud, and a range of accessory, service and support offerings. It sells its products worldwide through its online stores, its retail stores, its direct sales force, third-party wholesalers, and resellers. Apple Inc. is headquartered in Cupertino, California.
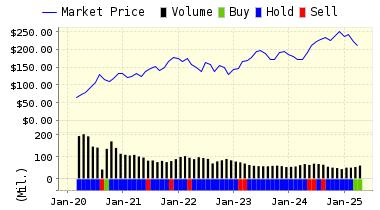
We have seen a rough few months for tech stock darling Apple, but some analysts believe that may be coming to an end. Yesterday, the stock hit the $100/share level for the first time since January. The shares had been battered over worries about declining iPhone sales as well as fears that emerging markets such as China were not going to lead to sales growth.
The company has garnered good publicity in the tech/libertarian worlds recently due to its refusal to accede to US law enforcement demands that it provide "back-door" access to the iPhone used by San Bernardino terrorists as well as in other cases. In addition, the company is reported to have some new products in the pipeline that may re-invigorate sales.
"Fanboys" are already discussing the probable upgrades to the iPhone7--which at this point include a possible dual-camera, stereo speakers, and waterproofing. In addition, the company is reportedly working on a smaller iPhone with a 4" screen, which is welcome news for users seeking a more convenient--and cheaper--form-factor for their smart phone.
Technical analysts argue that Apple crossed a significant level when it reached that $100/share price point, because it rose above its 50-day moving average. If the shares can add another 10%, investors of a more technical bent may jump in because that is considered a critical level based on last-year's price history.
Of course, we are not technicians here at ValuEngine, we only work off fundamental data to run our quantitative systems. We have had a buy rating on Apple for a long time. The underlying numbers are just too strong for our models to lower that rating. And our models cannot read rumors about iPhones, TVs, self-driving cars, etc. But, "the market is always right," and if technicians support a break out for Apple shares, that is one more piece of data to consider along with our positive ratings for the company.
ValuEngine continues its BUY recommendation on APPLE INC for 2016-03-01. Based on the information we have gathered and our resulting research, we feel that APPLE INC has the probability to OUTPERFORM average market performance for the next year. The company exhibits ATTRACTIVE Company Size and Sharpe Ratio.
|
ValuEngine Forecast |
||
|
Target |
Expected |
|
|---|---|---|
|
1-Month |
100.88 | 0.34% |
|
3-Month |
101.74 | 1.21% |
|
6-Month |
102.67 | 2.13% |
|
1-Year |
104.69 | 4.14% |
|
2-Year |
106.40 | 5.84% |
|
3-Year |
107.18 | 6.61% |
|
Valuation & Rankings |
|||
|
Valuation |
13.18% undervalued |
Valuation Rank(?) |
|
|
1-M Forecast Return |
0.34% |
1-M Forecast Return Rank |
|
|
12-M Return |
-22.12% |
Momentum Rank(?) |
|
|
Sharpe Ratio |
0.53 |
Sharpe Ratio Rank(?) |
|
|
5-Y Avg Annual Return |
13.01% |
5-Y Avg Annual Rtn Rank |
|
|
Volatility |
24.58% |
Volatility Rank(?) |
|
|
Expected EPS Growth |
1.20% |
EPS Growth Rank(?) |
|
|
Market Cap (billions) |
585.56 |
Size Rank |
|
|
Trailing P/E Ratio |
10.94 |
Trailing P/E Rank(?) |
|
|
Forward P/E Ratio |
10.81 |
Forward P/E Ratio Rank |
|
|
PEG Ratio |
9.14 |
PEG Ratio Rank |
|
|
Price/Sales |
2.49 |
Price/Sales Rank(?) |
|
|
Market/Book |
4.91 |
Market/Book Rank(?) |
|
|
Beta |
0.92 |
Beta Rank |
|
|
Alpha |
-0.21 |
Alpha Rank |
ValuEngine Market Overview
|
Summary of VE Stock Universe |
|
|
Stocks Undervalued |
66.65% |
|
Stocks Overvalued |
33.35% |
|
Stocks Undervalued by 20% |
31.28% |
|
Stocks Overvalued by 20% |
9.34% |
ValuEngine Sector Overview
|
Sector |
Change |
MTD |
YTD |
Valuation |
Last 12-MReturn |
P/E Ratio |
|
0.93% |
1.00% |
-0.43% |
2.75% overvalued |
-3.34% |
23.76 |
|
|
0.92% |
0.99% |
1.61% |
2.59% overvalued |
-6.64% |
22.71 |
|
|
2.22% |
2.53% |
-2.82% |
1.54% undervalued |
-19.70% |
17.82 |
|
|
1.37% |
1.47% |
-3.33% |
4.42% undervalued |
-18.06% |
17.67 |
|
|
1.52% |
1.65% |
-0.36% |
4.55% undervalued |
-12.46% |
25.93 |
|
|
0.25% |
0.48% |
2.90% |
5.19% undervalued |
-18.95% |
24.28 |
|
|
1.48% |
1.56% |
-5.26% |
5.26% undervalued |
-16.64% |
19.52 |
|
|
1.13% |
1.26% |
-2.79% |
7.29% undervalued |
-10.97% |
24.15 |
|
|
1.45% |
1.55% |
-4.01% |
8.16% undervalued |
-14.04% |
20.95 |
|
|
1.35% |
1.51% |
-5.77% |
8.18% undervalued |
-10.10% |
15.14 |
|
|
0.96% |
1.07% |
-2.37% |
9.00% undervalued |
-15.43% |
22.16 |
|
|
1.99% |
2.18% |
-2.68% |
13.78% undervalued |
-13.10% |
18.19 |
|
|
2.61% |
2.76% |
-5.25% |
14.60% undervalued |
-24.15% |
11.70 |
|
|
1.19% |
1.36% |
-12.48% |
16.98% undervalued |
-25.58% |
25.88 |
|
|
1.05% |
1.19% |
-4.83% |
17.19% undervalued |
-28.54% |
12.28 |
|
|
1.51% |
1.73% |
-4.55% |
18.47% undervalued |
-43.77% |
22.08 |
VALUATION WATCH: Overvalued stocks now make up 33.3% of our stocks assigned a valuation and 9.34% of those equities are calculated to be overvalued by 20% or more. Two sectors are calculated to be overvalued.
Comments
Log in or sign up to join the conversation.