
Analyst revisions can be used to identify incredible opportunities.
How many times have you seen the price gap overnight and rise sharply during the session? Price gaps are a frequent occurrence as price catches up with the sentiment. However, what caused such a sudden change in the opinion of the company? Frequently, the movement follows an analyst upgrade of a company. This post explores how to use positive analyst revisions to identify stocks with explosive potential.
Before we can dig into the data, it is important to understand who’s coming up with the numbers. An analyst is somebody who typically works for an investment bank or an investment firm. Such individuals know a wide array of fundamental analysis techniques and specialize in a particular industry or company.
Two Types
There are two types of analysts that do this type of work. The first is a buy-side analyst. These analyst recommendations help create a positive return for the firm.
The second type of analyst is a sell-side analyst. These analysts typically work for investment banks and provide their research and estimates to the public.
As investors, the information that we have at our disposal comes from sell-side analysts. These estimates for earnings, revenues, recommendations, and price targets are available for free by using the following websites:
· Finance.yahoo.com
· Finviz.com
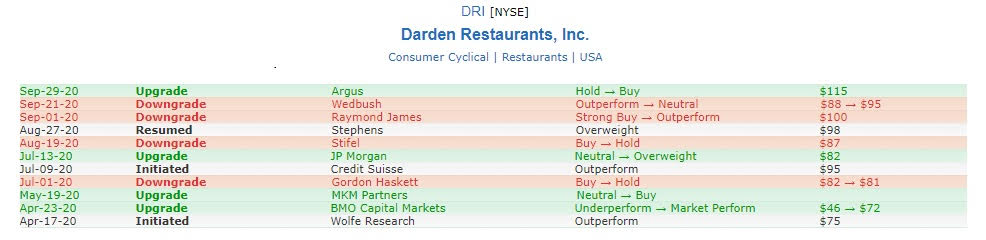
Finviz is a useful resource for seeing recent analyst recommendations and price targets. Analysts will typically provide a recommendation of whether to buy, sell, or hold a company. They may also give a price target. As analysts positively change their recommendation or price target, the price of the stock typically rises.
The image below is an example of what is available on Finviz for Darden Restaurants, Inc (NYSE: DRI). Notice that there was a recent analyst upgrade by Argus from a hold to a buy rating. However, the price target remained the same despite the upgrade.
Yahoo Finance is the most comprehensive resource for analyzing a company’s earnings trends. Here are point of analysis that could be done as part of this type of analysis:
1. Earnings estimates
2. Revenue estimates
3. Earnings history
4. EPS trend
5. 5-year projected EPS growth
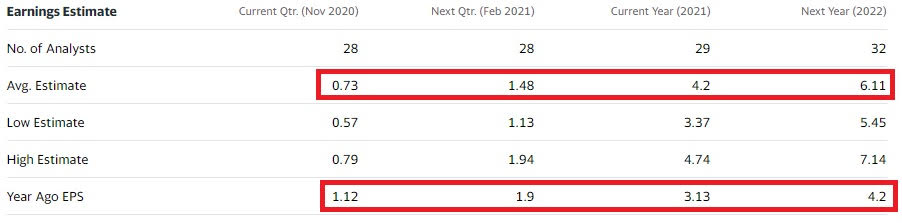
Earnings Estimates
First section of the Analyst Estimates page shows you the following: the number of analysts, the current average estimate, the estimate range, and the previous year’s earnings for the next two quarters and fiscal years.
This data allows you to compare the earnings growth of each period. In the DRI example below, the quarterly EPS is expected to decline in the next two quarters but rise in the next two fiscal years.
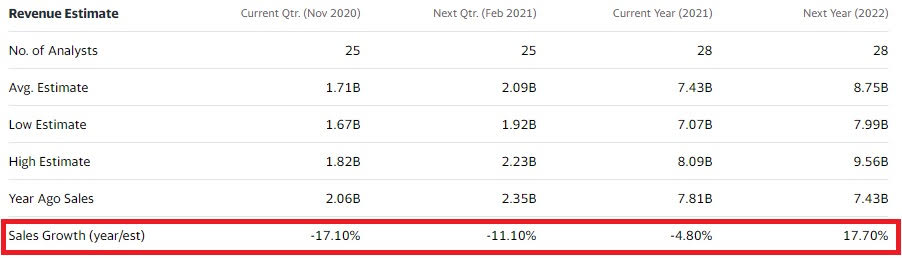
Revenue Estimates
A second area shows you the projected revenue growth for the coming quarters and fiscal years. Seeing revenue growth in line with EPS growth reflects an organically growing company. In the example below, revenue is expected to decline in the current fiscal year but rise 17.7% in the next.
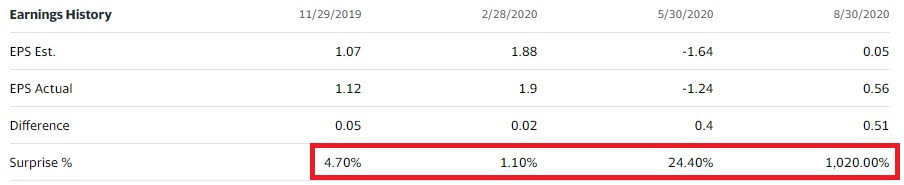
Earnings History
Next area to consider is how the company has performed against the analyst estimates. Companies that are beating analyst EPS estimates consistently typically perform well. Looking back at the past four quarters is an excellent way to see the trend.
If you want to see more than just four quarters of data, you can use Zacks.com. Using this information, you’ll see that DRI has beaten analyst estimates for at least four consecutive quarters. They’ve also beaten by increasing wider margins.
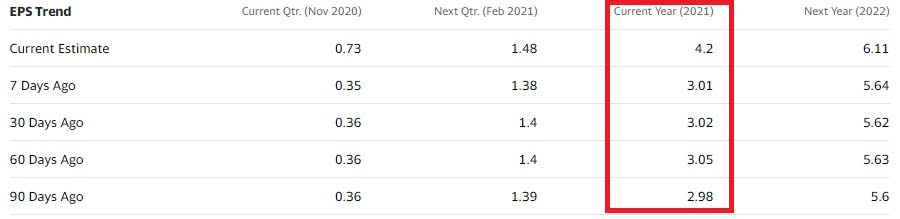
EPS Trend
Another area to consider is how analyst estimates are changing over time. If they are increasing earnings expectations, that is typically positive for the stock. Typically, the bigger the positive revision, the bigger the response from the price.
Current fiscal year revisions will be the most significant if there are at least two reporting quarters left. For DRI, there were substantial positive revisions across the board following their most recent earnings announcement.
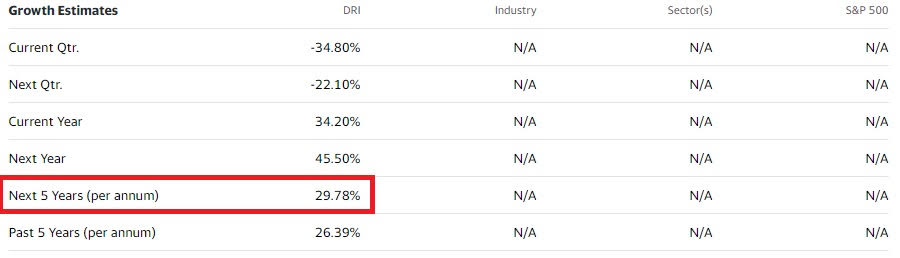
5-Year Projected EPS Growth
Finally, it’s good to see what type of earnings growth is expected in the future. Most companies that have analyst estimates for earnings and revenues will have a 5-year projected EPS growth rate. A rate of 15% or more is typical for growth stocks.
For DRI, the projected EPS growth rate is 29.78%. That’s higher than the past five years and reflects a strong recovery from the next two quarters that are expected to see a decline.
Conclusion
Positive analyst revisions have the potential to be the most impactful area of analysis for fundamental investors. This type of analysis can be a powerful combination with other factors you consider and can lead to explosive price movement.


Comments
Log in or sign up to join the conversation.