
Interest Rates
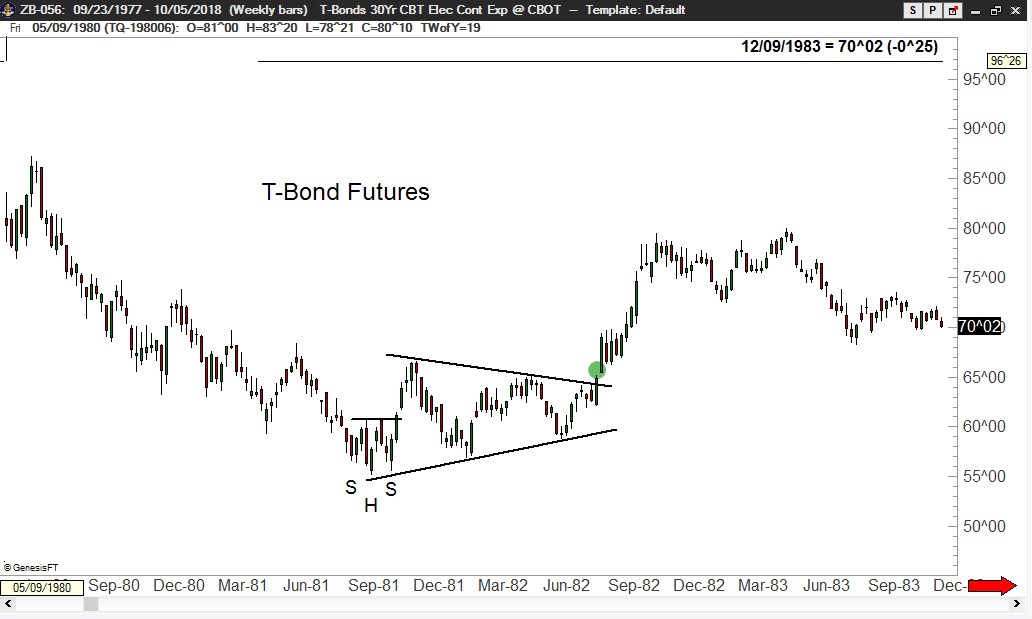
Being a trader for as long as I have been, provides me with a sense of historical significance not possible for newcomers to market speculation. I distinctly remember the high-interest rate periods of the 1970s and early 1980s. In fact, I remember the day the top of yields (and bottom of futures) was confirmed by the completion of a large symmetrical triangle (see chart). I remember the day this triangle was completed because I bought the upside breakout in futures. The completion of the H&S bottom on the weekly yield chart now completes the cycle that began in Aug 1982.
(Click on image to enlarge)
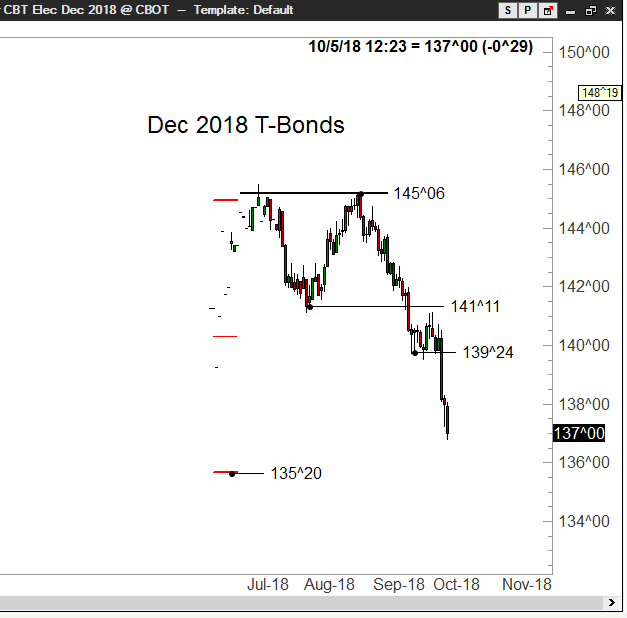
Fast forward to today, the decline below 141^27 on the daily continuation graph completed an H&S bottom failure pattern with a target of 135^11. The daily chart of the Dec 2018 contract is also shown (with resistance at 139^24 and a target at 135^20.
(Click on image to enlarge)
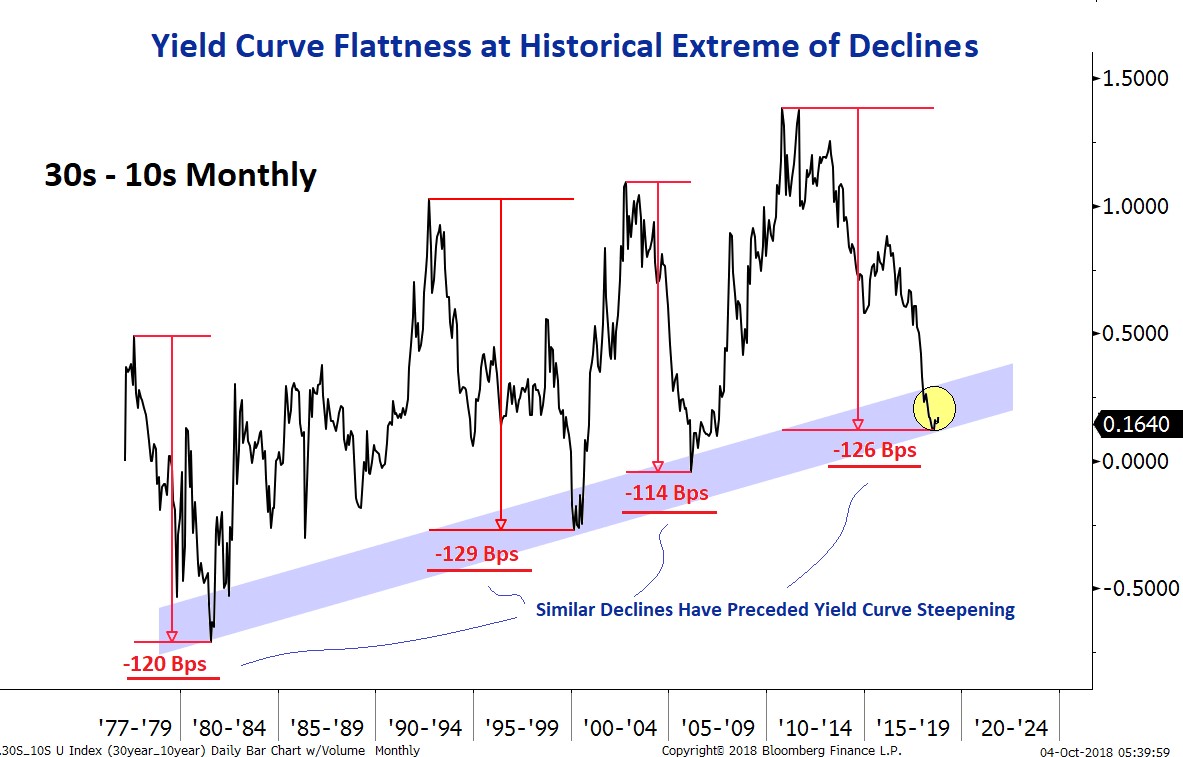
Our friends at Nautilus Capital produced an interesting graph this past week showing that the yield curve of U.S. treasuries is turning up from a cyclic low. This implies that yields at the long end of the curve will advance faster than yields at the short end of the yield curve.
(Click on image to enlarge)
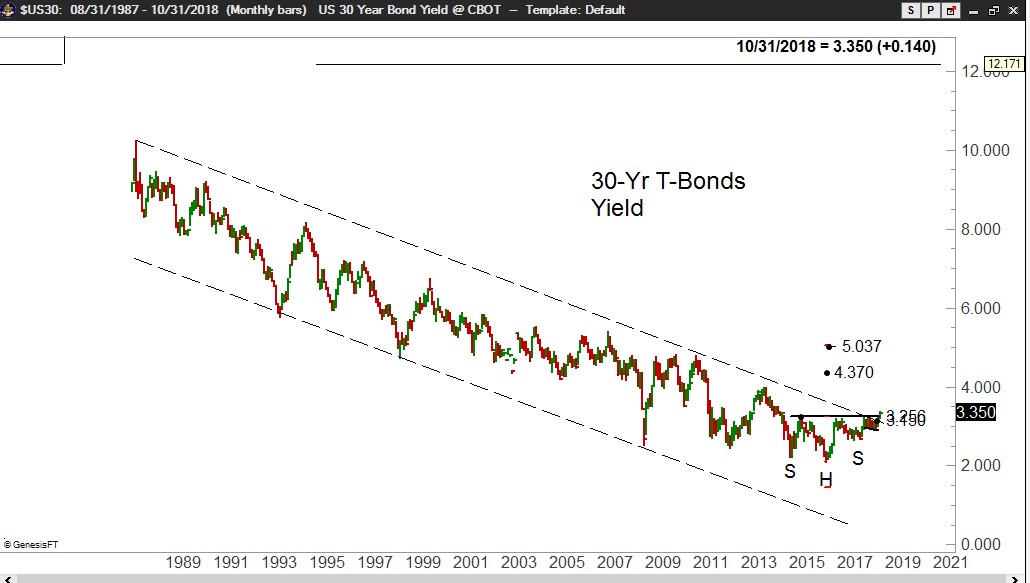
A Generational Low?
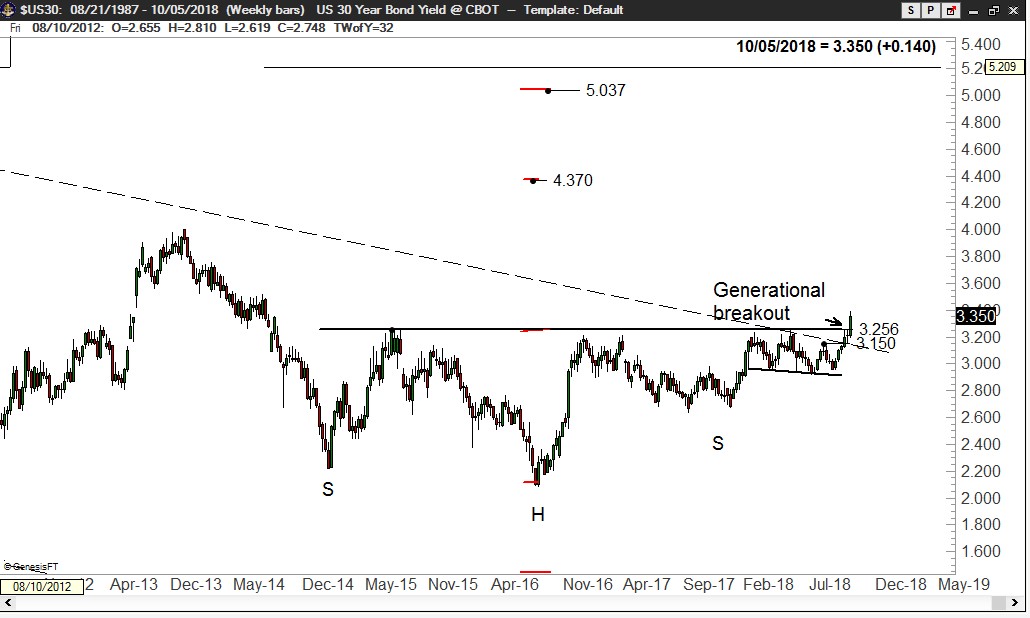
Two chart observations are worthy of note. First, the advance this past week in yields completed a 4+ year H&S bottom on the weekly chart with targets of 4.37% and 5.03%. Second, the advance this past week also penetrated the upper boundary of a multi-decade channel. It is my belief that an Interest Rate Generational Low has been confirmed in yields.
Weekly
(Click on image to enlarge)
Monthly
(Click on image to enlarge)


Comments
Log in or sign up to join the conversation.