

Despite differing opinions and continuing uncertainty about the long-term damage to the global economy from the coronavirus, now labeled Covid-19, the S&P 500 Index made new intraday or closing highs every day last week. Then last Tuesday, crude oil, one of the most sensitive macro indicators, stopped declining. The Market Review includes our regular update along with a SPDR S&P 500 ETF (SPY) put spread hedge report followed by a United States Oil Fund, LP (USO) contrarian long call spread idea to consider.
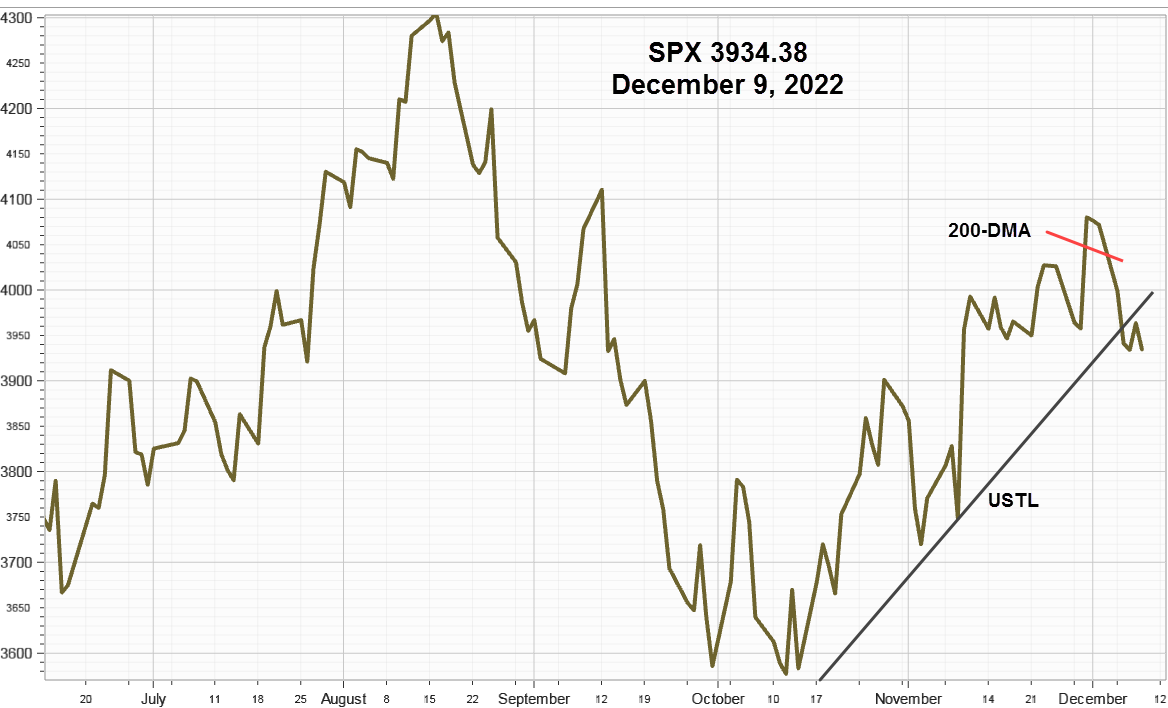
S&P 500 Index (SPX) 3380.16 climbed 52.45 points or another +1.58% last week, making four new intraday highs along with four new closing highs. Support from the operative upward sloping trendline (USTL) that began on October 3 and the 50-day Moving Average are close together around 3255, well below last week's closing highs.
CBOE Volatility Index® (VIX) 13.68 declined 1.79 points or -11.57% last week. Our similar IVolatility Implied Volatility Index Mean, IVXM using four at-the-money options for each expiration period along with our proprietary technique that includes the delta and vega of each option, declined 2.00 points or -15.63% ending at 10.80%.

VIX Futures Premium
This next chart shows as our calculation of Larry McMillan’s day-weighted average between the first and second-month futures contracts.
With only one actual trading day until February expiration, the day-weighted premium between February and March allocated 10% to February and 90% to March, for a premium, of 11.84%, at the edge of the bullish green zone vs.4.72% for week ending February 7. February futures expire tomorrow so the front month excess premium goes away today.
The premium measures the amount that futures currently trade above or below the cash VIX, (contango or backwardation) until front month futures contract converges with the VIX at the next futures expiration on Wednesday.

On Fridays before monthly expirations, the volume-weighted premium version at 8.88% likely provides a better reading. Despite SPX making multiple new highs last week, the VIX remained somewhat higher at 10.80% vs. the December 16 low at 8.98%.

Put Spread Hedge Report
SPDR S&P 500 ETF (SPY) 337.60 up 5.40 or +1.63 for the week. After closing above the SU (stop/unwind) last Monday, the put spread suggestion in Digest Issue 6 " Buying the Dip [Charts]" was canceled. Paradoxically, a rising U.S dollar index suggests additional money flowing into SPY and other dollar-denominated assets seeking safety.
WTI Crude Oil

CL basis March futures 52.05 up 1.73 or 3.44% for the week. Last Monday it began making a small double bottom while waiting to see if Russia will join the effort to reduce OPEC production again.
Then, this chart from Barchart.com shows the decline returned the price back to the 5-year seasonal average.

After the price decline from concerns about declining global demand from Covid-19, Friday's March futures contract closed just .04 below the 5-year seasonal average.
From being overly optimistic at the start of the year, Covid-19 was responsible for reducing price back the 5-year seasonal average.
From the Disaggregated Commitments of Traders - Options and Futures Combined report as of February 11, what were our friends at the various "Managed Money" trading desks throughout the world doing last Tuesday as the cash price gained .39?
For the purpose of the report, "Managed Money" are registered commodity trading advisors (CTAs), registered commodity pool operators (CPOs), such as commodity ETF managers or unregistered funds identified by CFTC engaged in managing and conducting organized futures trading on behalf of clients. So-called “hedge funds” are included in this category, regardless of whether they are registered.
With substantial financial risk and a vast information network "Managed Money,” the group that best correlates with crude oil price changes and arguably the most important, speculate on future prices.
"Managed Money" reduced their longs 9,293 contracts but also covered 110 short contracts for a net change of -9,184 contracts, reducing their net long position to 4.32% of the open interest from 4.56% on February 4.
The net long position as a percentage of the open interest shows it declining from above 10% at the start of the year to now approaching 4% again.

This chart shows a small increase in their short position from 3.76% to 3.82%. At the last trough on December 17, when prices typically decline in December, their short position was 1.14% of the open interest.

Last week they covered 110 short futures contracts suggesting waning enthusiasm for the short side. Will WTI follow the seasonal path higher this week or succumb to Covid-19 fear of demand destruction? The answer should come this week.
From the contrarian playbook: " Bad times make for good buys."
United States Oil Fund, LP (USO) 10.95 up .37 points or +3.50% for the week. After both the 14-day RS1and MACD indicators turned up from being deeply oversold the long side looks like an interesting contrarian idea.
With current historical volatility of 27.22 and 19.62 using the Parkinson's range method, with an Implied Volatility Index Mean of 33.91 at .47 of its 52-week range, the implied volatility/historical volatility ratio using the range method is 1.73, so option prices are somewhat expensive compared to the recent movement of the ETF. Friday’s option volume was 88,125 contracts traded compared to the 5-day average volume of 106,360 contracts with favorable bid/ask spreads.
Consider this long call spread contrarian idea.

Without implied volatility edge, on Friday the debit was .47. Although the short call only provides limited price decline protection, it will help offset some time decay and declining implied volatility if USO continues higher as expected. Use a close back below the small double bottom pattern at 10.38 for the SU (stop/unwind).
Strategy
In bull markets, the strategy is to stay long equities and/or ETFs and then tactically hedge declines as soon as they begin developing. Last week there were no signs of an imminent pullback.
Summary
Despite, or perhaps because of the Covid-19 worries, the S&P 500 Index continued higher making new intraday and or closing highs every day last week. Since the futures and options indicator remained constructive for the bulls, there are no reasons for new hedges. However, oversold crude oil looks ready to bounce, providing a contrarian long opportunity.
Comments
Log in or sign up to join the conversation.