

American Express (AXP) enters the final months of 2026 with solid fundamentals but a mixed near-term technical outlook. Wall Street remains broadly constructive, with consensus ratings leaning toward Buy and average targets near $365. Recent targets range from roughly $320 to $425, showing meaningful disagreement about the stock's near-term upside.
Meanwhile, American Express reported record third-quarter revenue of $20.1 billion and raised its full-year earnings guidance. Card spending, fee growth, and strong credit quality continue supporting the longer-term outlook. However, AXP still trades well below its January peak, while our Elliott Wave structure favors a deeper correction first. Therefore, we focus on where wave (II) can finish before buyers return for the next major advance.
Elliott Wave Outlook: AXP Weekly Chart September 05th, 2026
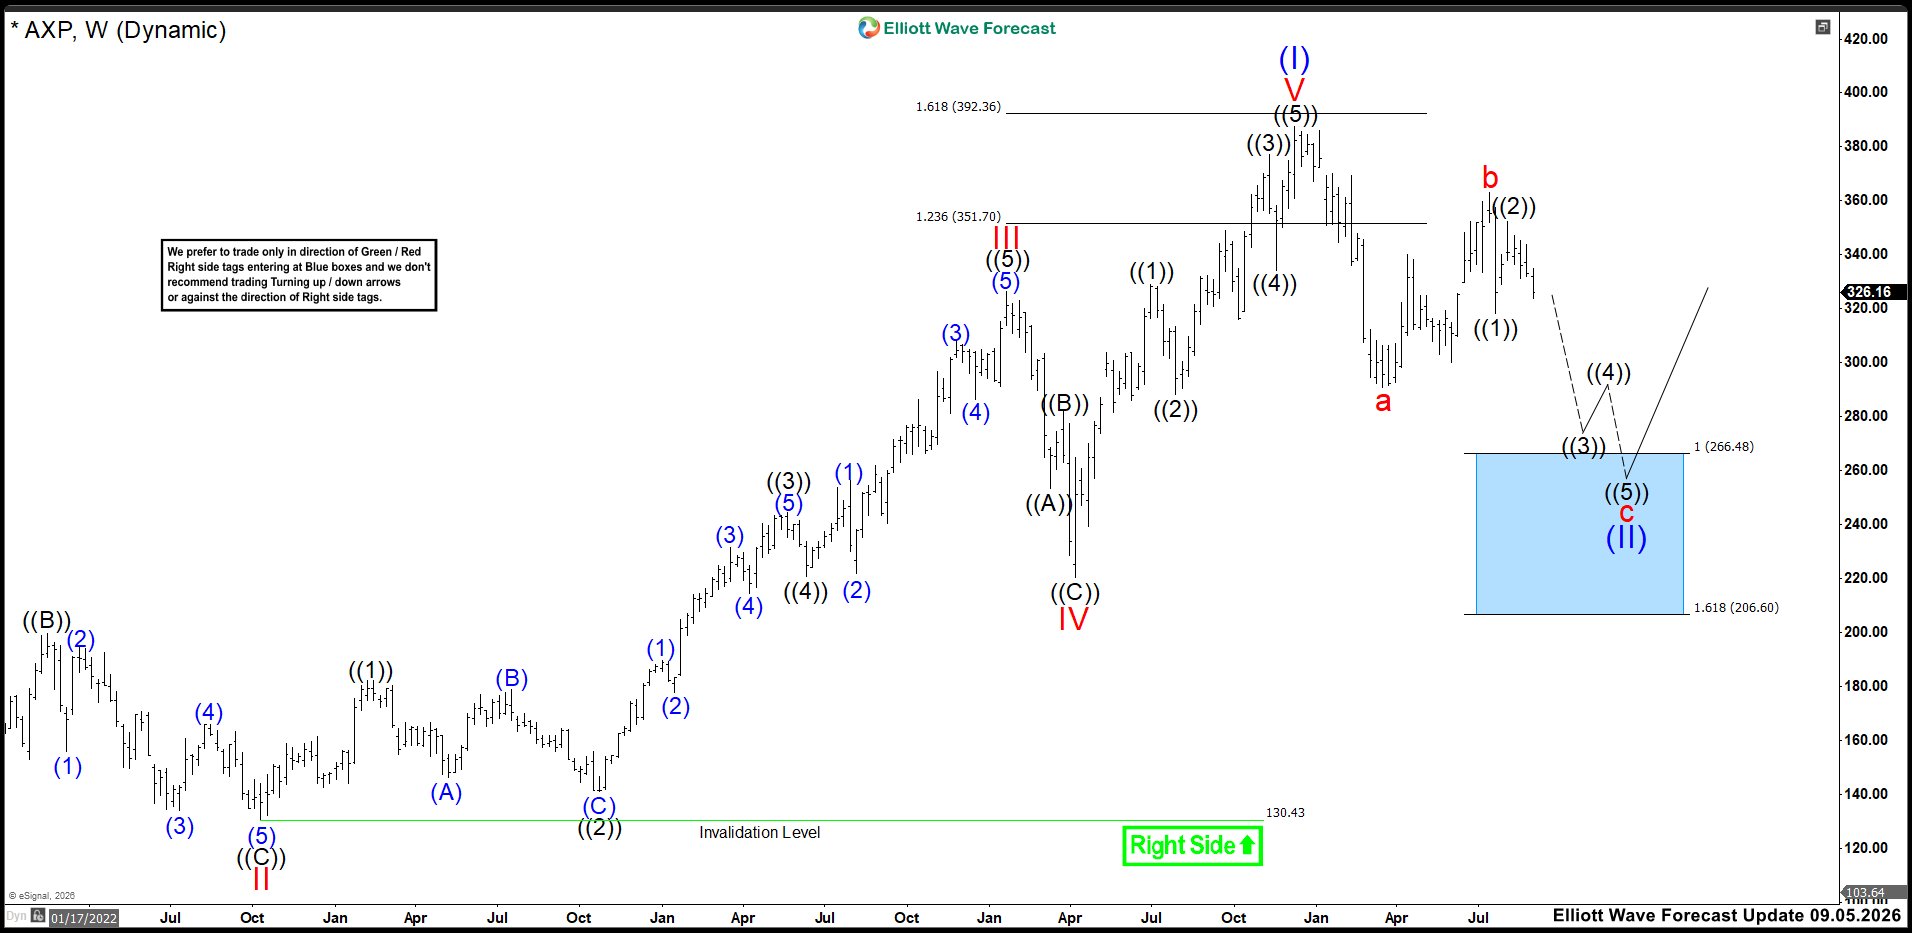
On September 5, we expected AXP to continue correcting the cycle from the October 2022 low. We viewed the 387.49 high as wave (I). Therefore, we expected the decline from that peak to develop as wave (II).
At that time, wave a had already completed, while wave b ended at 363.14. Consequently, we expected wave c to extend lower in five waves. Our preferred target remained the 266.48–206.60 Blue Box area. However, we continued viewing the decline as corrective within the larger bullish cycle.
We expected buyers to appear from that Blue Box and complete wave (II). Then, AXP should resume the larger bullish trend. Ultimately, we expected the next advance to break above the 387.49 wave (I) high.
Elliott Wave Principle Behind the Market Structure
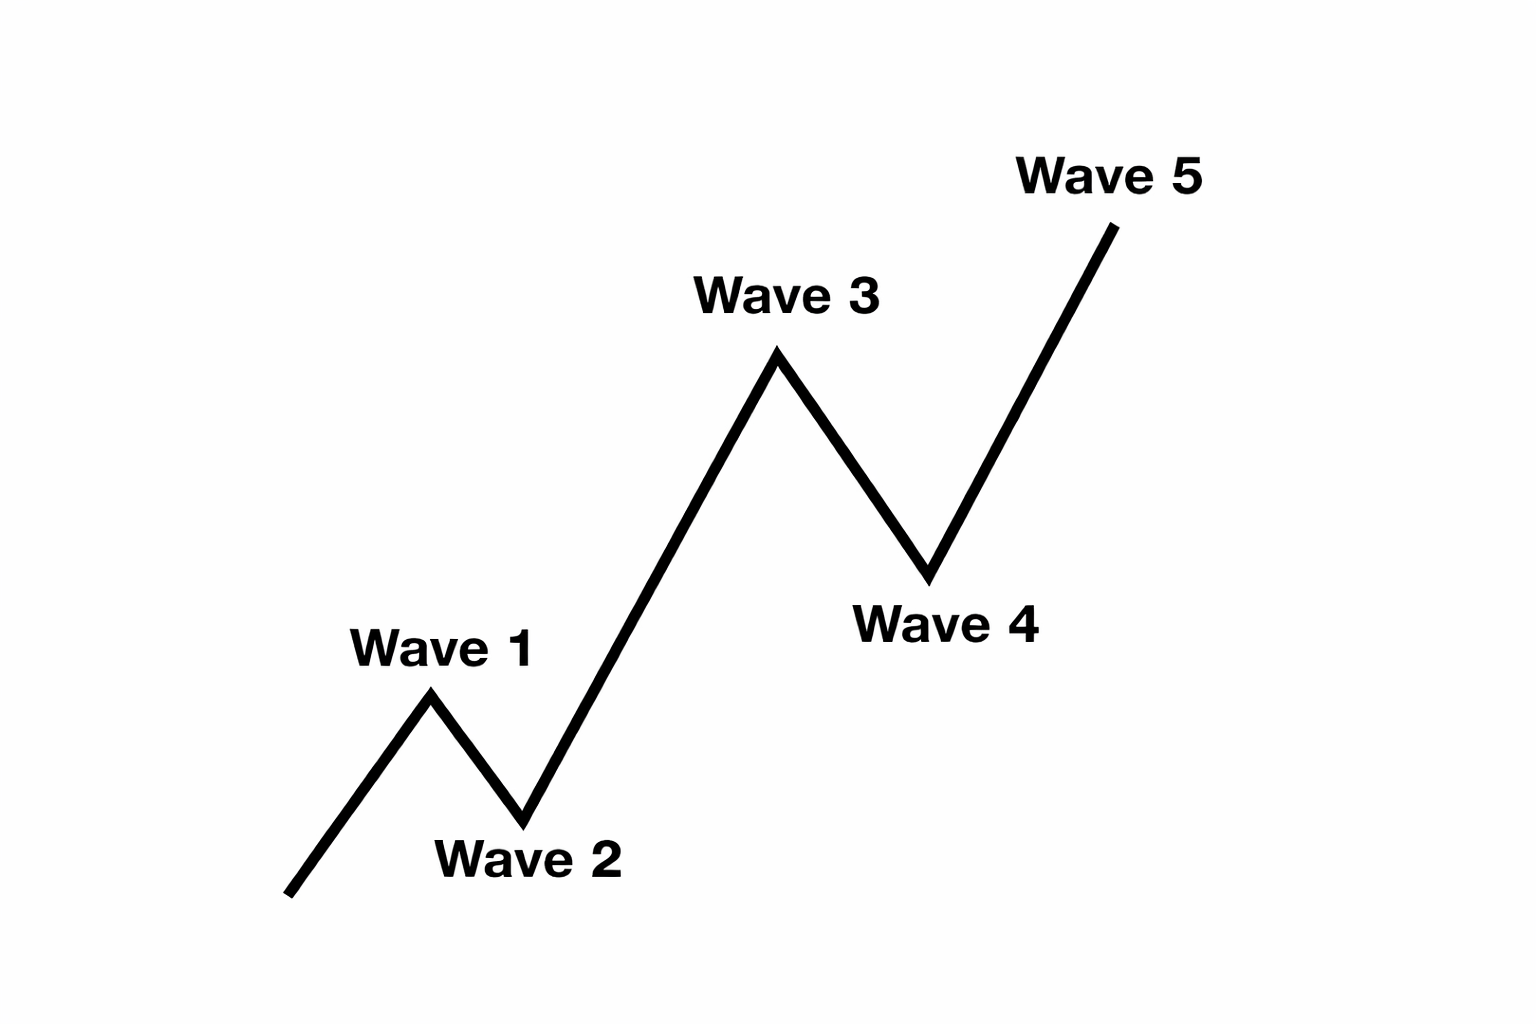
Impulse
An impulse is a clean 5‑wave pattern that drives the trend forward.
Waves 1‑3‑5 are strong and directional.
No overlap between waves 1 and 4.
Wave 3 is usually the strongest.
Structure is clear, with increasing momentum
Elliott Wave Outlook: AXP Weekly Chart November 15th, 2026
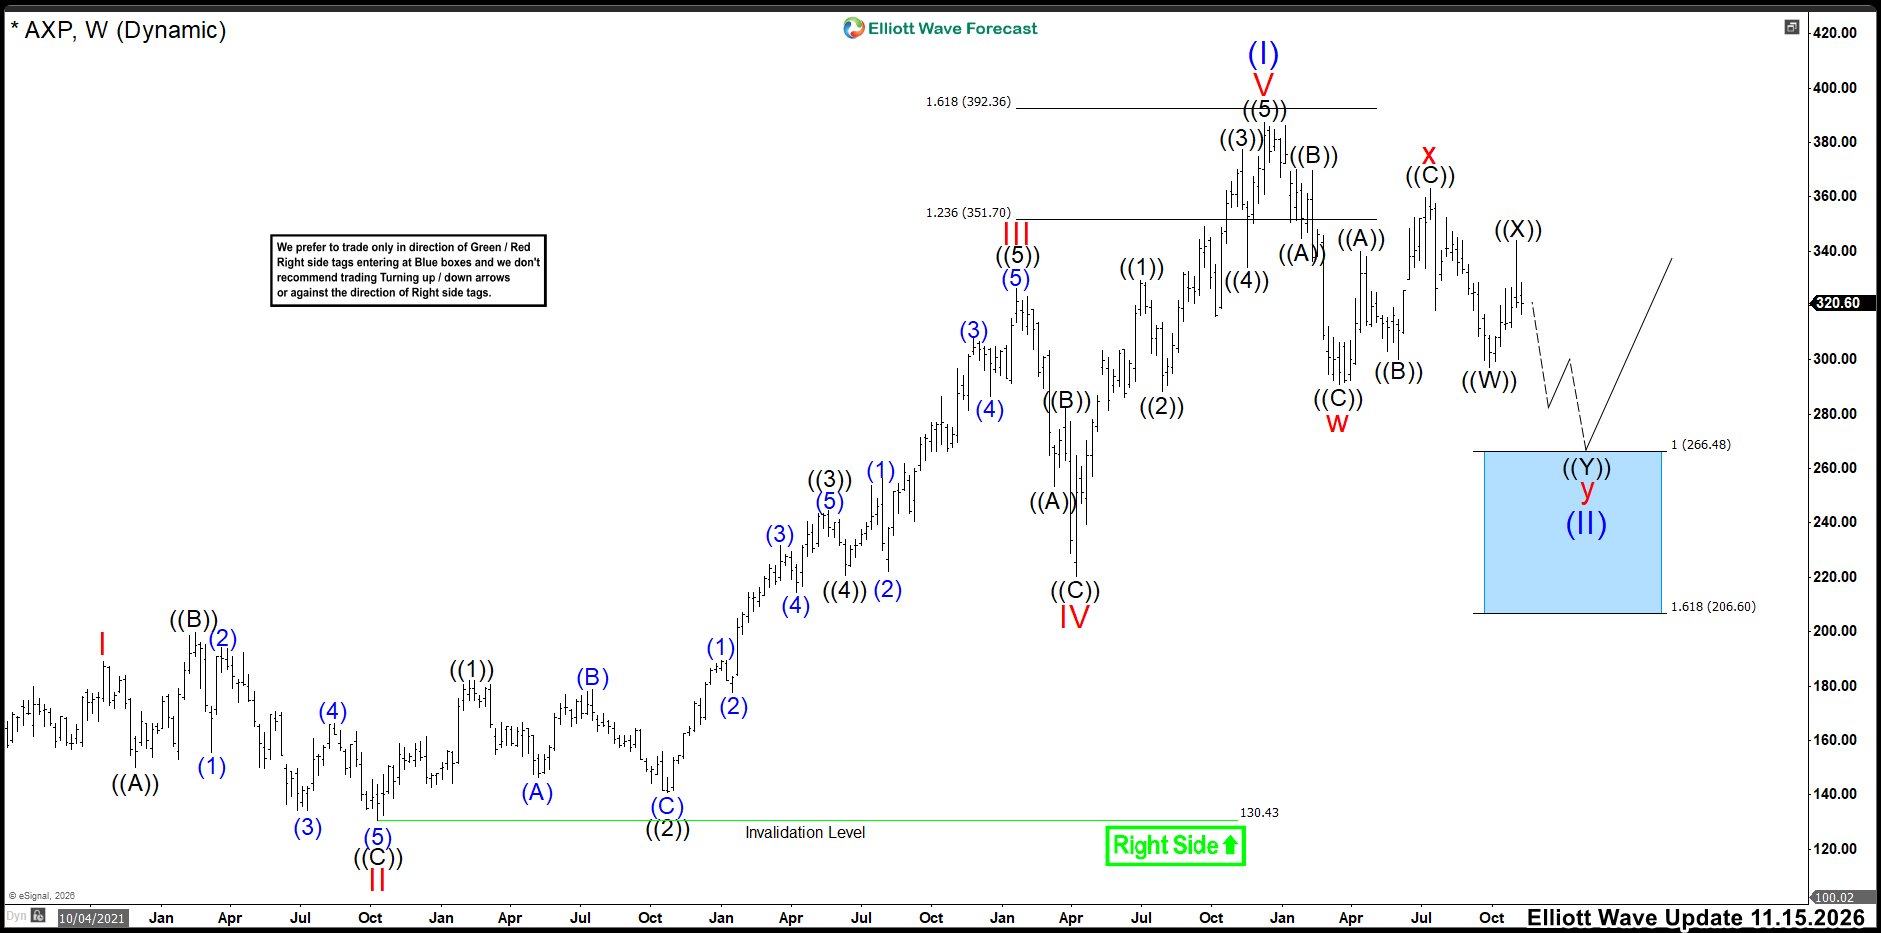
AXP has changed its corrective structure since our September outlook. The decline no longer favors a simple A-B-C correction for wave (II). Instead, price now supports a larger double correction in W-X-Y. Wave W ended with the April decline, while wave X completed near the July rebound. Since then, AXP has started the second corrective sequence. Therefore, we expect wave Y to extend lower and complete wave (II).
Importantly, this structural change does not alter our main target area. We still expect wave (II) to reach the 266.48–206.60 Blue Box. Consequently, we continue viewing that area as the preferred buying zone. The larger bullish cycle remains intact while AXP stays above 206.60. Once wave (II) finishes, buyers should regain control. Ultimately, we expect AXP to break above 387.49 and continue toward new all-time highs.



Comments
Log in or sign up to join the conversation.