

Hello fellow traders,As our members know, we've identified numerous profitable trading opportunities recently. In this technical article, we'll take a closer look at our AMD stock trading setup and show how it unfolded.
AMD Elliott Wave Daily Hour Chart – 11.01.2026
AMD was developing a three-wave pullback from the October 6 high, and the correction still appeared incomplete. Our analysis at the time suggested that wave (c) was still in progress, with the downside target pointing toward the 420.6–323.8 Blue Box buying zone.
As always, we use the Fibonacci Extension tool to project the potential ending area of a correction. This allows us to identify a high-probability entry zone with a clearly defined invalidation level.
With the broader trend still bullish, we expected buyers to step in within the marked Blue Box area. From there, AMD was expected to produce at least a three-wave bounce, with the potential to extend higher and eventually challenge new highs.
Once the bounce reaches the 50% Fibonacci retracement level measured against wave (B)'s high, we will move the stop-loss to breakeven , making the long position risk-free.A break below the 1.618 Fibonacci Extension level at 323.8 would invalidate this bullish setup.
This is the type of opportunity we regularly identify in the market: a clearly defined entry zone, a specific invalidation level, and a structured trading plan to manage risk as price develops.
The official trading strategy for identifying 3, 7, and 11 swings and Equal Legs setups is explained in detail in our educational video. The video is available exclusively to members inside the membership area.
How to Read Our Charts
Red bearish stamp + Blue Box = Selling setup
Green bullish stamp + Blue Box = Buying setup
Black stamp = No trade zone
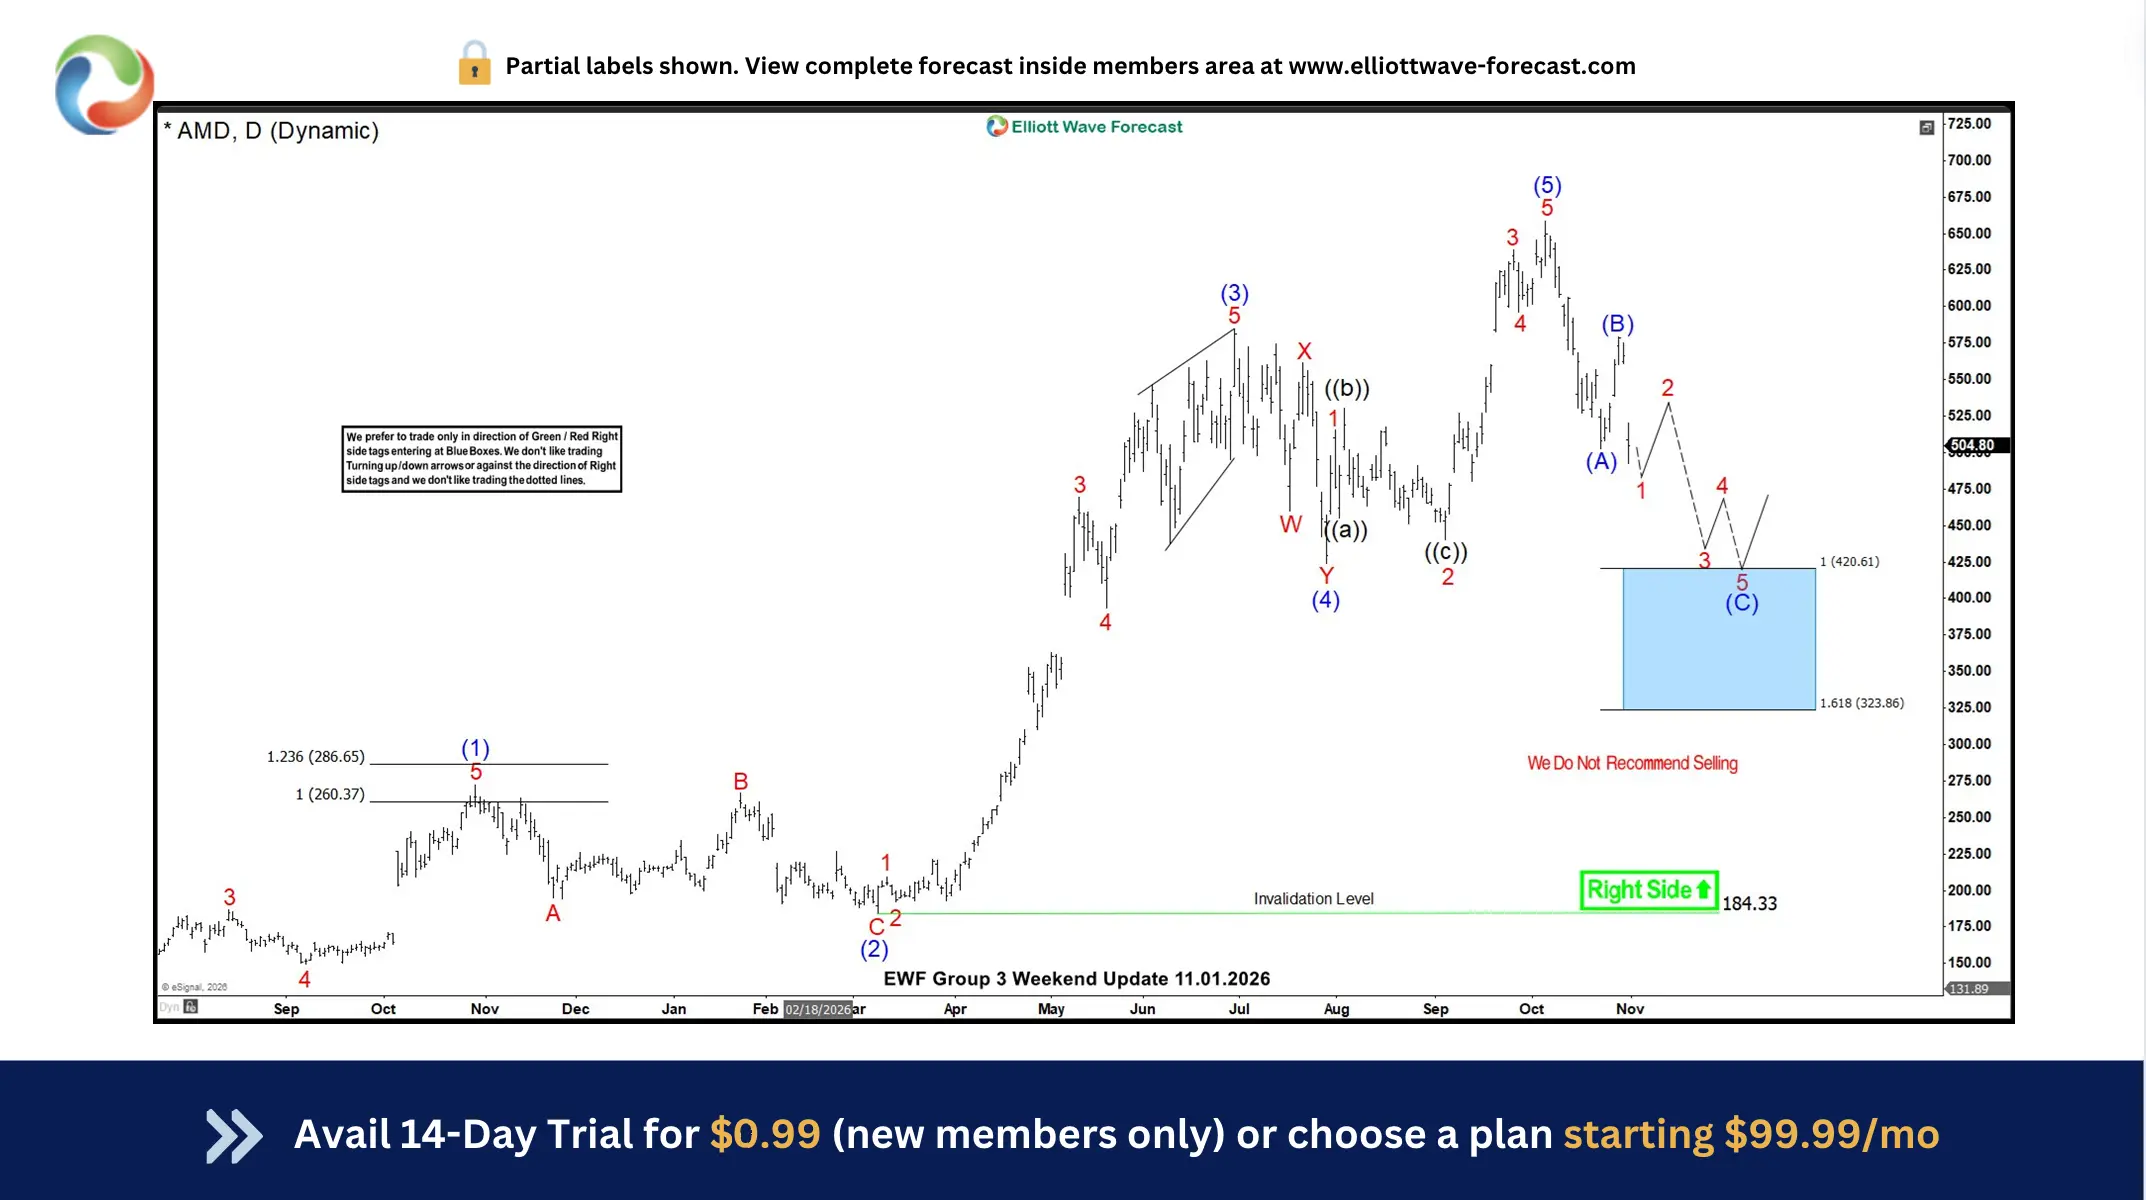
AMD Elliott Wave Daily Hour Chart – 11.01.2026
The trading setup played out perfectly. AMD reached our Blue Box buying zone, where buyers stepped in and triggered the anticipated recovery. Since then, the stock has staged a strong rebound.Members who entered the trade are now enjoying profits while holding risk-free positions, after moving their stop-losses to breakeven.
Keep in mind that the market is dynamic, and the view presented here may have changed in the meantime. Follow our latest charts, trading setups, and target levels inside our membership area.The best instruments to trade are those with incomplete bullish or bearish swings. These setups are highlighted in our Sequence Report, while the highest-conviction opportunities are presented in the Live Trading Room.
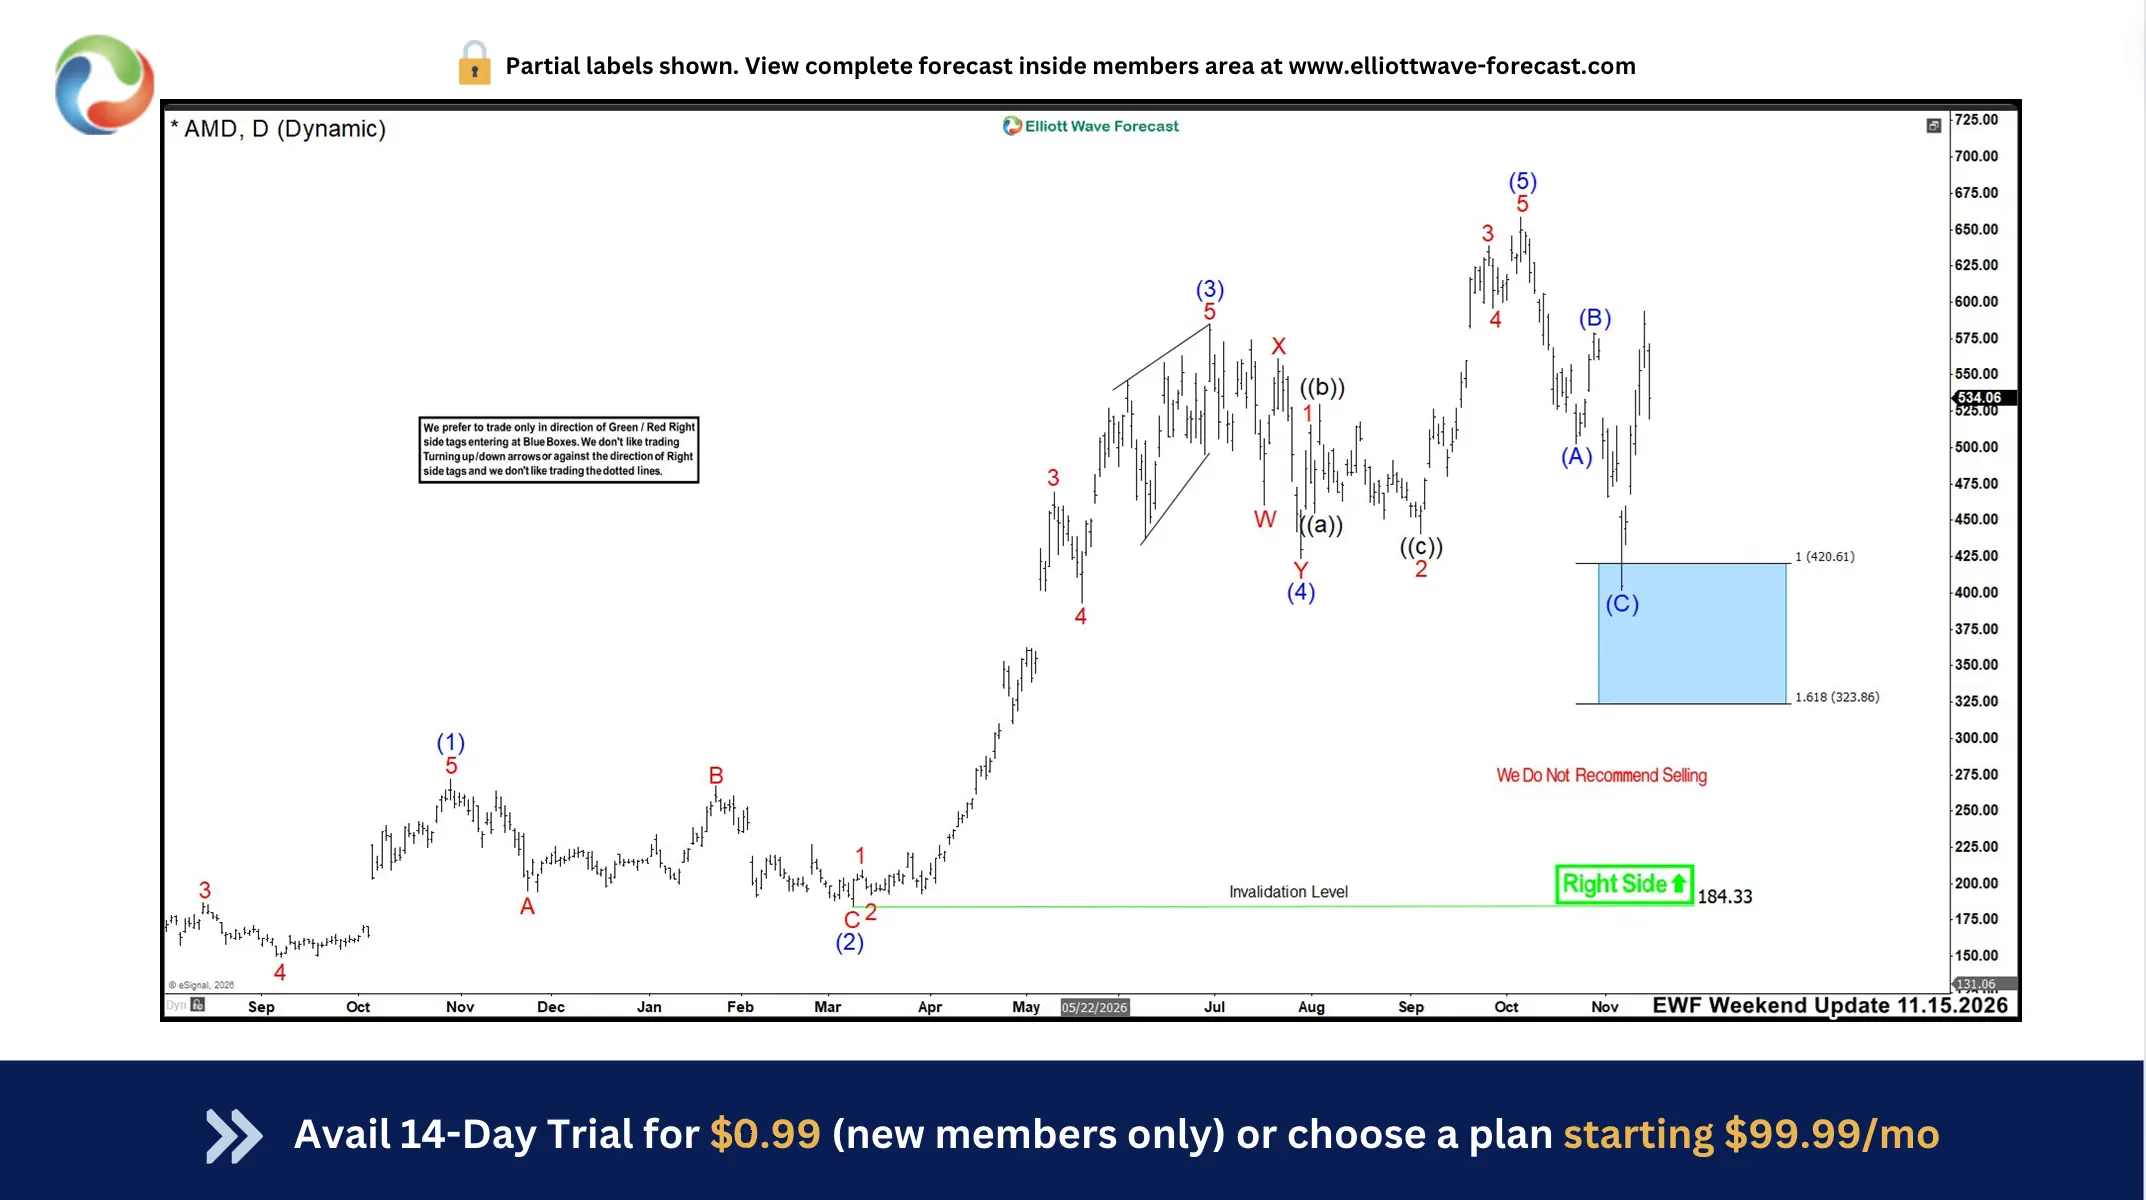
Source: https://elliottwave-forecast.com/stock-market/amd-stock-blue-box-trading-setup-delivers-a-rally/



Comments
Log in or sign up to join the conversation.