

Hello, fellow traders. In this technical blog, we’ll take a closer look at our Elliott Wave charts for Advanced Micro Devices (AMD), published in the members’ area of our website. We identified incomplete bearish sequences within the cycle from the October 6th peak, signaling further downside. In the following analysis, we’ll review the Elliott Wave structure and see how the market followed our outlook.
AMD Elliott Wave 4-Hour Chart – November 1, 2026
The break below the October 22nd low, marked as (A) blue, confirmed the incomplete bearish sequences within the cycle from the October 6th peak at 659.22. These types of price structures are very important because incomplete swing sequences can help us anticipate the market’s next move with high accuracy.
The outlook suggested further short-term weakness in the following days. The stock remained bearish against the 581.76 peak, marked as (B) blue on the chart. As long as the price stayed below this level, we expected further downside.
The cycle was forming an Elliott Wave Zigzag pattern. Therefore, we identified the potential downside target by measuring the (A)-(B) Equal Legs area using the Fibonacci Extension tool. In this case, the Equal Legs target zone was at 426.40–389.87. At that zone, we expected buyers to step in and take the lead again, potentially triggering a significant rally toward new highs or, at a minimum, a larger three-wave bounce.
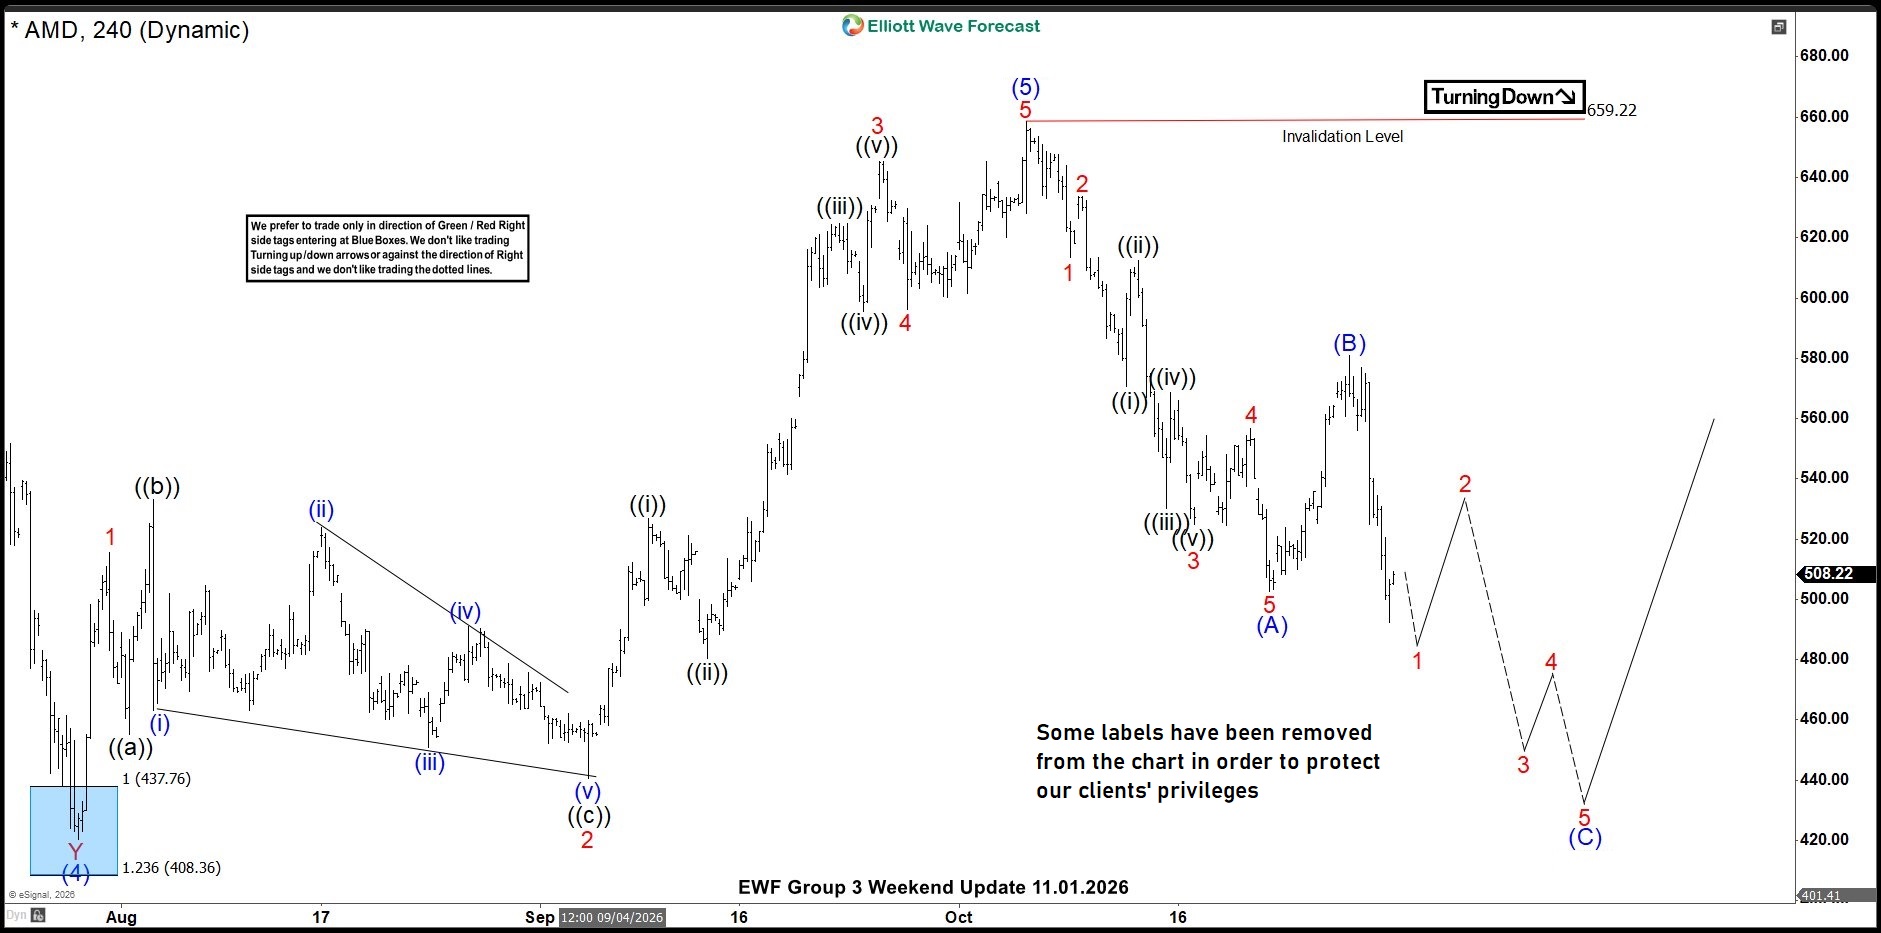
AMD Elliott Wave 4-Hour Chart 11.01.2026
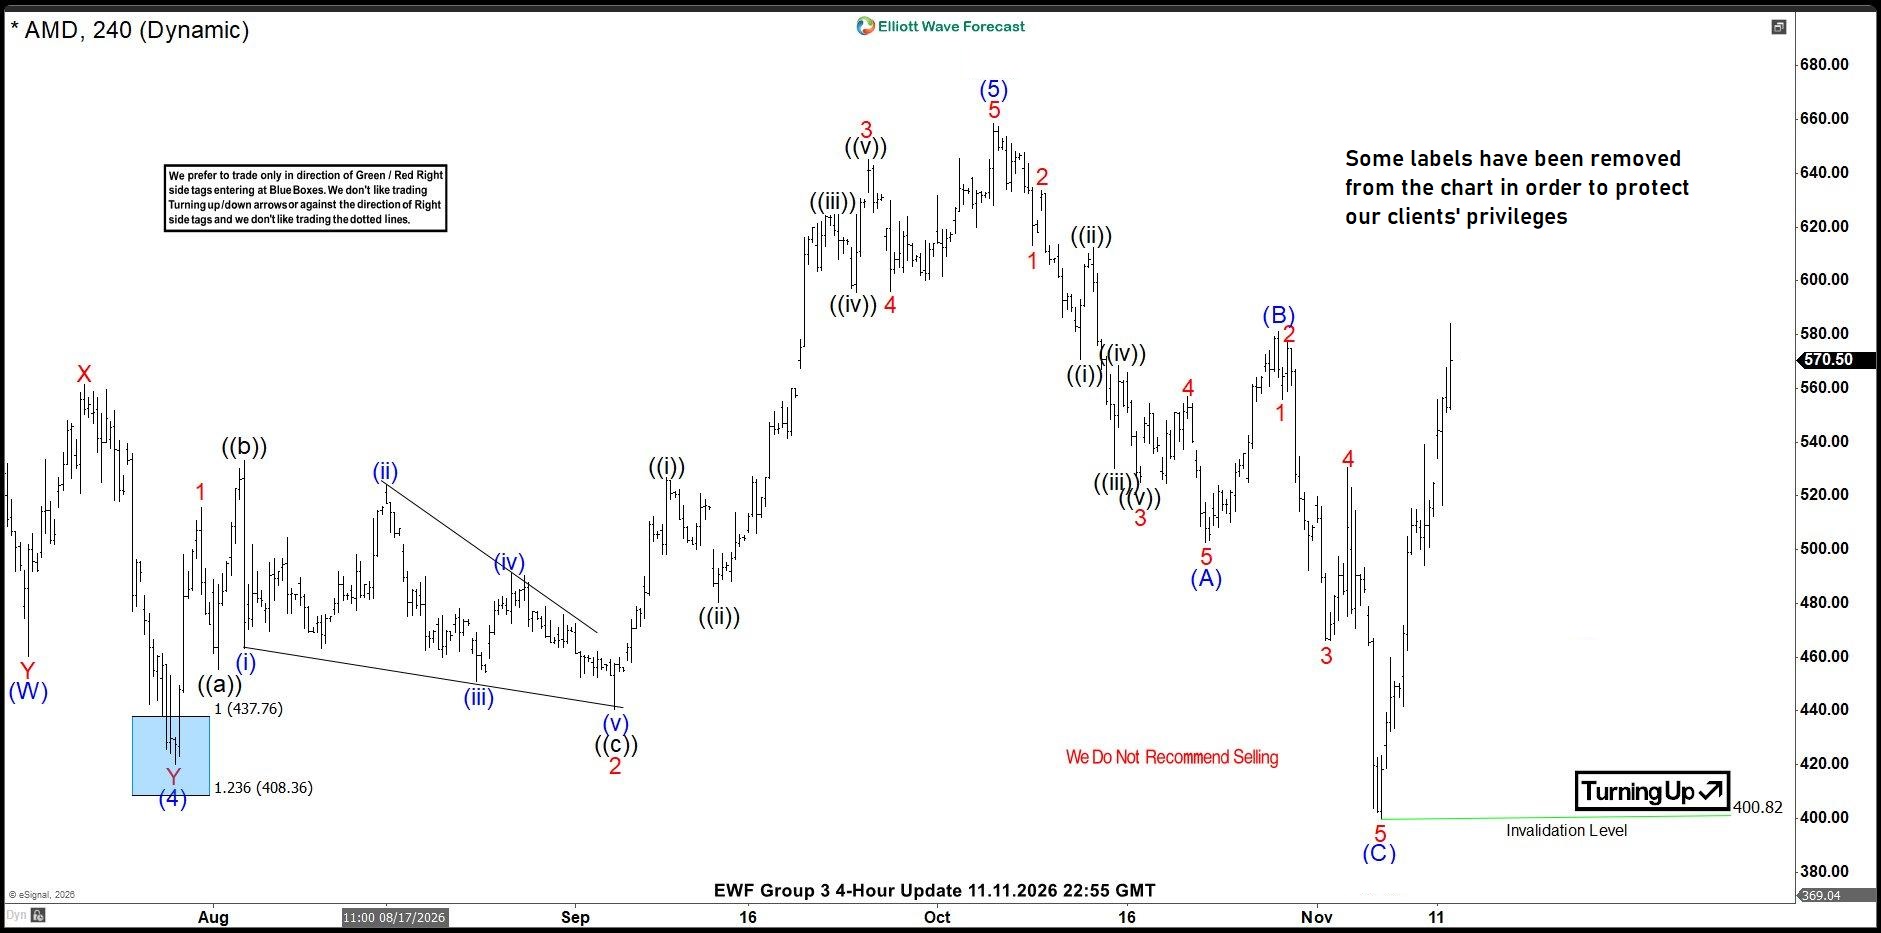
The stock followed the expected path lower. AMD reached the proposed (A)-(B) equal legs target area at 426.40–389.87, found buyers as anticipated, and completed the cycle at the 400.82 low. A sharp rally followed from the buyers' zone.
This is exactly the type of analysis we teach in our Live Analysis / Trading Sessions, where members learn how to identify incomplete sequences, understand their significance, and use them to anticipate the market's next move. Keep in mind, not every chart is a trading recommendation. We present high-probability trading opportunities in our Live Trading Room.
Note: Some labels have been removed from the chart to protect our clients' exclusive analysis. You can find the latest AMD charts in the members' area of our website.



Comments
Log in or sign up to join the conversation.