

February 2020 could prove to be a historic month for Amazon. The company of 'everything' officially became the fourth tech company to join the $1 trillion club, after Apple, Microsoft and Alphabet (Google).

It's been a remarkable journey for Amazon whose share price was trading under $100 just 11 years ago. It currently sits comfortably above the $2,000 price level but some analysts believe it could hit $3,000 by mid-2021. Let's take a look at the company in more detail.
Amazon earnings prove to be a winner
In Amazon's most recent earnings report the company smashed expectations by reporting fourth-quarter earnings per share of $6.47 against an analyst average expectation of $4.03. That alone got investors very excited, helping the stock price surge more than 10% in after-hours trading.
Some of the key facts from the earnings report include:
- Record quarterly signups for Prime with more than 150 million paying members around the world.
- Orders have more than doubled in 2,000 communities where Amazon offers free grocery delivery to Prime members.
- Alexa now being users by more businesses with Fiat Chrysler adding the virtual assistant to its car infotainment systems.
- AWS cloud continues to expand which is a key growth area and profit driver.
It was only in May 2019, that one analyst came out with a $3,000 price level target for Amazon shares to be reached by mid-2021 at the earliest. The call from the investment banking giant, Piper Jaffray, may not seem so outlandish anymore. This is only made stronger by the fact all the trillion-dollar tech giants have faced several investigations on their business practices and market dominance by the Department of Justice and Federal Trade Commission in recent years - yet their share prices still continue to outperform.
How to Trade Amazon
Below is the long-term, monthly price chart of Amazon's share price:
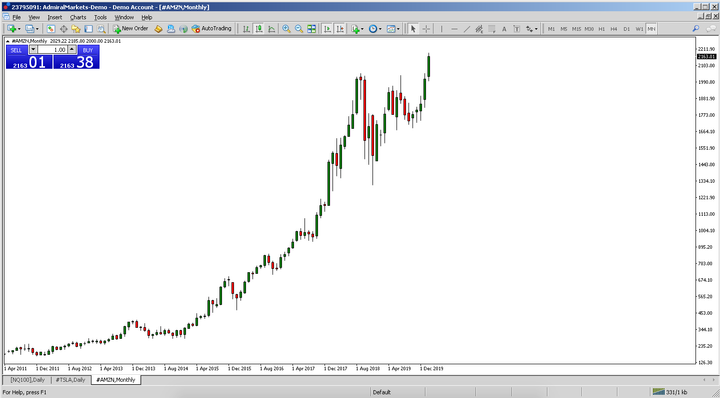
Source: Admiral Markets MetaTrader 5, AMZN, Monthly - Data range: from 1 April 2011 to 13 February 2020, accessed on 13 February 2020 at 10:15 am GMT. Please note: Past performance is not a reliable indicator of future results.
With Admiral Markets you can speculate on the price direction of Amazon's share price by using a CFD (Contract for Difference) which allows traders to go long and short on the market, using leverage. You can learn more about leverage in the 'What is Leverage in Forex Trading?' article.
While the monthly chart above shows a clear trend higher, the weekly chart shows periods of trends, as well as consolidations (where prices move sideways), as shown below:
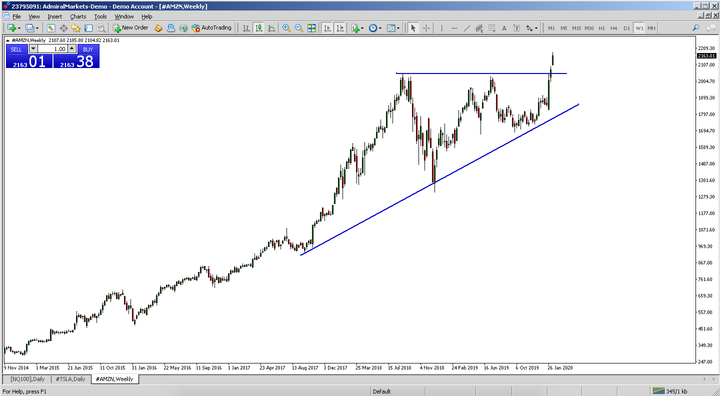
Source: Admiral Markets MetaTrader 5, AMZN, Weekly - Data range: from 9 November 2014 to 13 February 2020, accessed on 13 February 2020 at 10:45 am GMT. Please note: Past performance is not a reliable indicator of future results.
Much of the recent consolidation in Amazon's share price is highlighted between the two blue lines in the chart above. This type of chart pattern is known as an ascending triangle formation or wedge pattern. It is known as a bullish chart pattern as the market makes a series of swing higher low cycle formations before breaking through an identifiable horizontal resistance line.
Amazon shares did break above the blue horizontal line in the chart above, thanks to a much better than expected fourth-quarter earnings report as discussed earlier in this article. The pattern is suggesting further upside. Many traders would then work their way through the lower time frames such as the daily, four-hour, one-hour and thirty-minute chart to find suitable long, or buy entries.
Finding price levels on where to enter and exit and how to risk manage the trade are dependent on the type of trading strategy used by individual traders and the indicators used for technical analysis. For example, on the thirty-minute chart below, Amazon's share price tends to turn around the 21-period exponential moving average (the blue wavy line). Traders will often use indicators like moving averages to help identify the trend, as well as levels of support and resistance which could lead to turning points in the market.
(Click on image to enlarge)
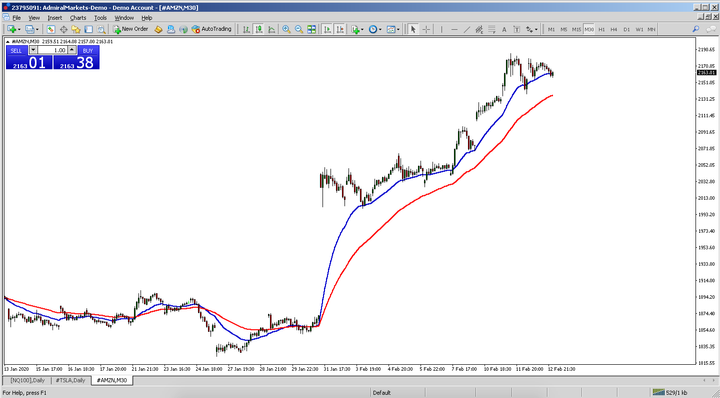
Source: Admiral Markets MetaTrader 5, AMZN, M30 - Data range: from 13 January 2020 to 13 February 2020, accessed on 13 February 2020 at 11:00 am GMT. Please note: Past performance is not a reliable indicator of future results.



Comments
Log in or sign up to join the conversation.