
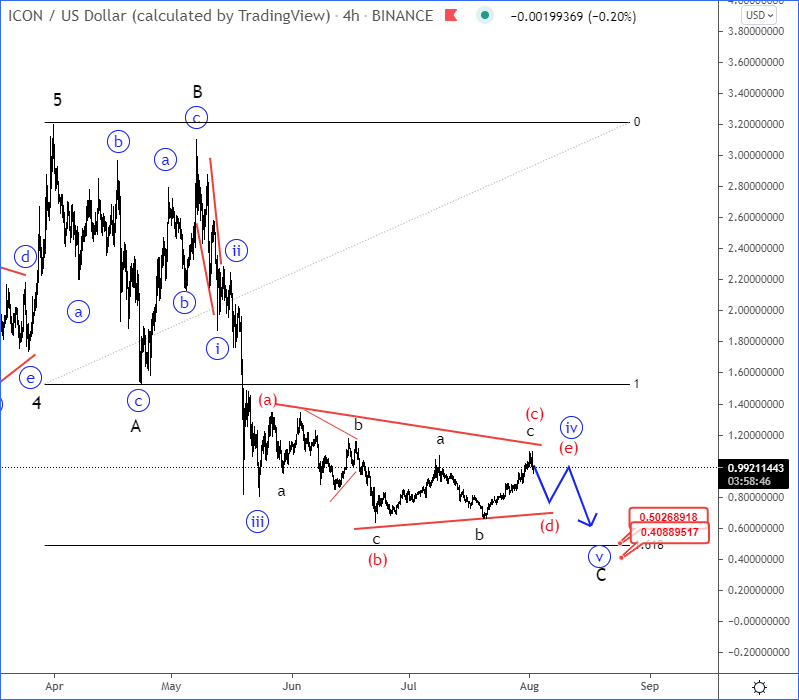
- ICXUSD unfolds running triangle
- ICXUSD can retest 0.50 – 0.40 support area
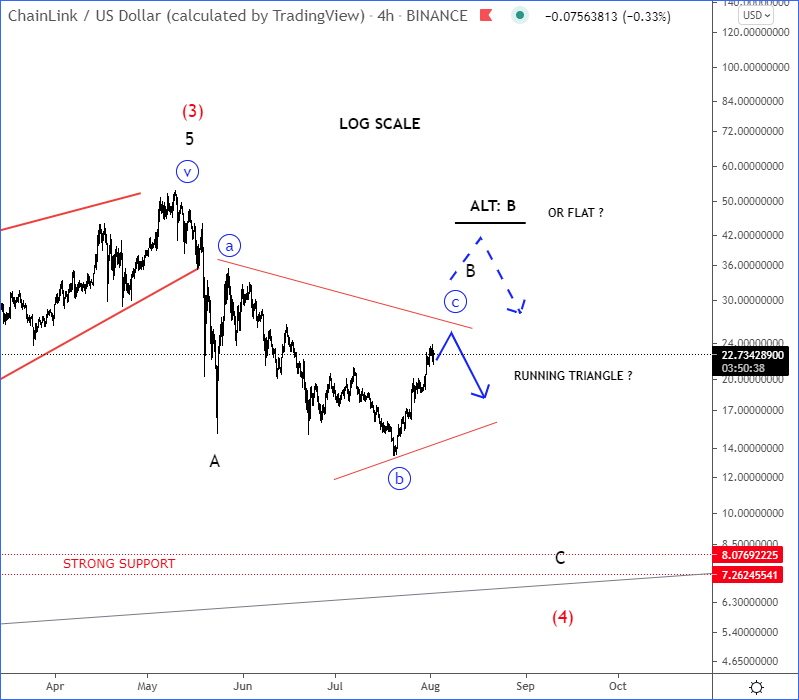
- LINKUSD price may face another sell-off

ICXUSD. Well, despite recent bigger intraday recovery, the wave structure still looks corrective, ideally as part of a bigger bearish running triangle within wave "iv", similar as on other major cryptocurrencies. So, still be aware of a retest of the lows and 0.50 - 0.40 support area for wave "v" of C before a bullish reversal (ICX-X).
ICXUSD 4h Elliott Wave Analysis Chart
LINKUSD (LINK-X) made strong intraday recovery from the lows, but we still see an unfinished A-B-C correction, as strong support at 8-7 area is still open. So, we believe that current rally is just as part of wave B correction that can be either a running triangle if stays sideways or maybe even flat if we see a jump up to 30-40 area. In both cases be aware of another sell-off for wave C towards projected 8-7 zone.
LINKUSD 4h Elliott Wave Analysis Chart


Comments
Log in or sign up to join the conversation.