
Alphabet (GOOGL) is presenting an interesting technical setup that has me watching closely. There are bullish elements developing on the chart, but several factors still give me pause before committing capital to the long side.
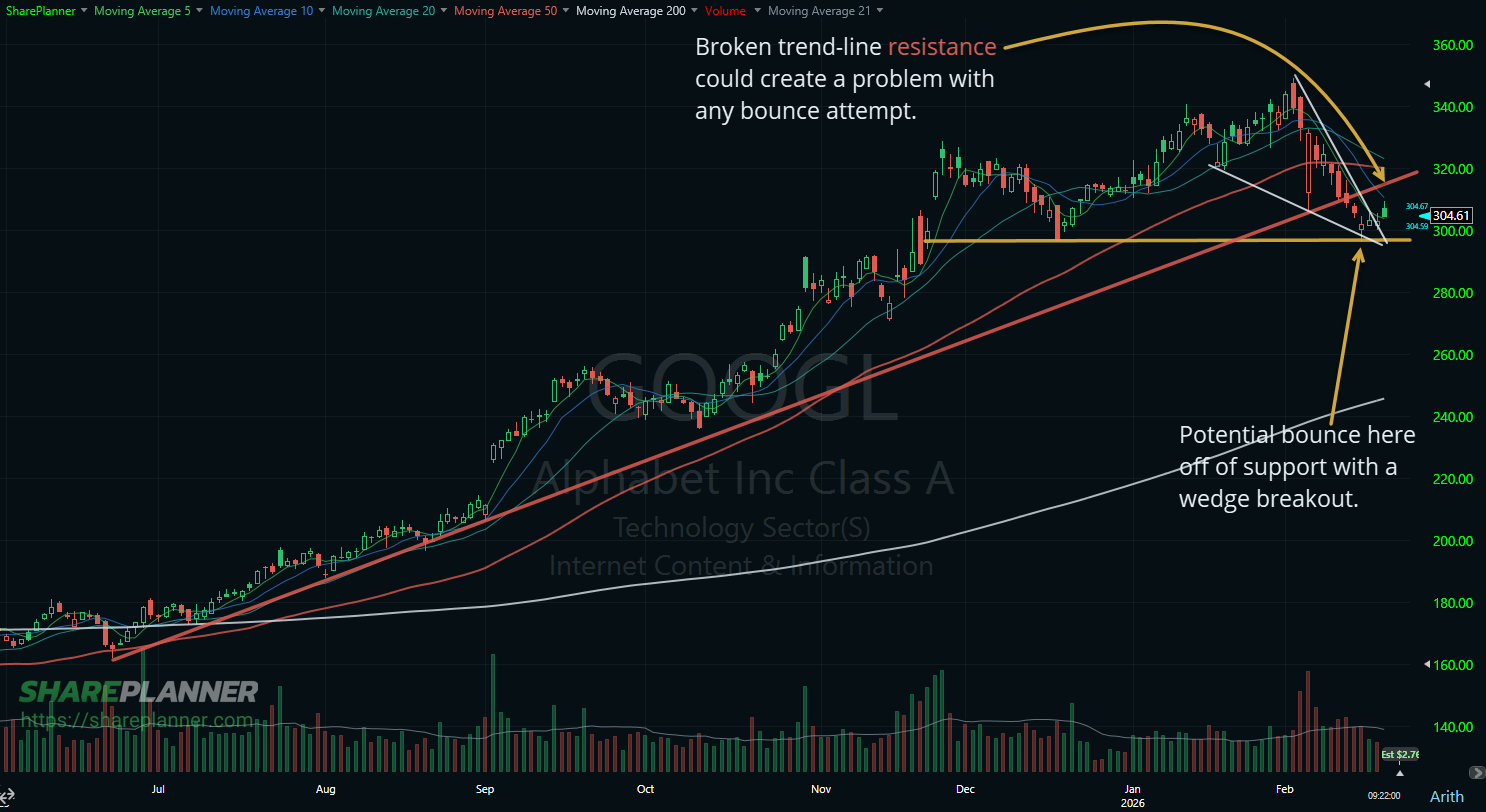
The Bullish Case: Support and Pattern Development
The stock has found support at previous lows, which is encouraging. When price bounces from a level that held before, it suggests buyers are stepping in at that zone. That is the kind of behavior you want to see when considering a long position.
More notably, GOOGL has formed a falling wedge pattern. A falling wedge is typically considered bullish because it shows selling pressure weakening as trend lines converge. Price makes lower highs and lower lows, but the lows become progressively shallower, suggesting the decline is losing momentum. A breakout above the upper trend line is the trigger that often leads to a move higher.
Volume is important here. If price is holding support, you want to see buyers show up on tests of that level. And if the stock breaks above wedge resistance, you want volume expanding to confirm the move is real rather than a quick false breakout.
The Bearish Concern: Broken Resistance Overhead
This is where caution comes in. There is broken support overhead that can now act as resistance. When support breaks, it often flips into a ceiling. Price frequently rallies back to test that old level before either pushing through or rejecting lower.


Comments
Log in or sign up to join the conversation.